Friday, August 11, 2023

Performance Comparison of 5 JDKs on Apache Spark

Dive into a comprehensive load-testing exploration using Apache Spark with CPU-intensive workloads. This blog provides a comparative analysis of five distinct JDKs' performance under heavy-duty tasks generated through Spark. Discover a meticulous breakdown of our testing methodology, tools, and insightful results. Keep in mind, our observations primarily indicate the test toolkit and system's performance rather than offering a broad evaluation of the JDKs.

In this post, we'll also emphasize:

  • The rationale behind focusing on CPU and memory-intensive workloads, especially when handling large Parquet datasets.
  • The load testing tool's design: stressing CPU and memory bandwidth with large Parquet files.
  • Key findings from our tests, offering insights into variations across different JDKs.
  • Tools and methods employed for the most accurate measurements, ensuring our results are as reflective of real-world scenarios as possible.

Join us on this journey to decipher the intricate landscape of JDKs in the realm of Apache Spark performance!

On the load testing tool and instrumentation

What is being measured:

  • this is a microbenchmark of CPU and memory bandwidth, the tool is not intended to measure the performance of Spark SQL.
  • this follows the general ideas of active benchmarking: a load generator is used to produce CPU and memory-intensive load, while the load is measured with instrumentation.

Why testing with a CPU and memory-intensive workload:
In real life, the CPU and memory intensive workloads are often the most critical ones. In particular, when working with large datasets in Parquet format, the CPU and memory-intensive workloads are often the most critical ones. Moreover, workloads that include I/O time from object storage can introduce a lot of variability in the results that does not reflect the performance of Apache Spark but rather of the object storage system. Working on a single large machine also reduces the variability of the results and makes it easier to compare the performance of different test configurations.

The test kit:
The testing toolkit used for this exercise is described at test_Spark_CPU_memory.

  • The tool generates CPU and memory-intensive load, with a configurable number of concurrent workers.
  • It works by reading a large Parquet file. The test setup is such that the file is cached in the system memory therefore the tool mostly stresses CPU and memory bandwidth.

Instrumentation:
The workload is mostly CPU-bound, therefore the main metrics of interest are CPU time and elapsed time. Using sparkMeasure, we can also collect metrics on the Spark executors, notably the executors' cumulative elapsed time, CPU time, and time in garbage collection.

Workload data:
The test data used to generate the workload is a large Parquet table, store_sales, taken from the open source TPCDS benchmark. The size of the test data is 200 GB, and it is stored in multiple Parquet files. You can also use a subset of the files in case you want to scale down the benchmark. 
The files are cached in the filesystem cache, so that the test kit mostly stresses CPU and memory bandwidth (note, this requires 512GB of RAM on the test system, if you have less RAM, reduce the dataset size).

Download using download using: wget -r -np -nH --cut-dirs=2 -R "index.html*" -e robots=off https://sparkdltrigger.web.cern.ch/sparkdltrigger/TPCDS/store_sales.parquet

Test results:
Tests were run using the script spark_test_JDKs.sh that runs test_Spark_CPU_memory.py with different JDKs and prints out the results. The output of three different tests were collected and stored in txt files that can be found in the Data folder.

Test system:
A server with dual CPUS (AMD Zen 2 architecture), 16 physical cores each, 512 GB RAM, ~300 GB of storage space.

Spark configuration:
We use Apache Spark run in local mode (that is on a single machine, not scaling out on a cluster) for these tests, with 64GB of heap memory and 20 cores allocated to Spark. The large heap memory allocation is to reduce Garbage Collection overhead, which still fits in the available RAM.
The number of cores for Spark (that is the maximum number of concurrent tasks being executed by Spark) is set to 20, which brings the CPU load during the test execution to use about 60% of the physical cores, the workload keeps the CPUs busy with processing Parquet files, the rest of the CPU power is available for running other accessory load, notably Garbage collection activities, the OS and other processes.

Example performance test results:
This shows how you can use the toolkit to run the performance tests and collect performance measurements:

$ export JAVA_HOME=.... # Set the JDK that will be used by Spark
$ ./test_Spark_CPU_memory.py --num_workers 20 # Run the 3 tests using 20 concurrent workers (Spark cores)

Allocating a Spark session in local mode with 20 concurrent tasks
Heap memory size = 64g, data_path = ./store_sales.parquet
sparkmeasure_path = spark-measure_2.12-0.23.jar
Scheduling job number 1
Job finished, job_run_time (elapsed time) = 43.93 sec
...executors Run Time = 843.76 sec
...executors CPU Time = 800.18 sec
...executors jvmGC Time = 27.43 sec
Scheduling job number 2
Job finished, job_run_time (elapsed time) = 39.13 sec
...executors Run Time = 770.83 sec
...executors CPU Time = 755.55 sec
...executors jvmGC Time = 14.93 sec
Scheduling job number 3
Job finished, job_run_time (elapsed time) = 38.82 sec
...executors Run Time = 765.22 sec
...executors CPU Time = 751.68 sec
...executors jvmGC Time = 13.32 sec

Notes:
The elapsed time and the Run time decrease with each test run, in particular from the first to the second run we see a noticeable improvement, this is because various internal Spark structures are being "warmed up" and cached. In all cases, data is read from the Filesystem cache, except for the first warm-up runs that are discarded. Therefore, the test kit mostly stresses CPU and memory bandwidth. For the test results and comparisons, we will use the values measured at the 3rd run of each test and average over the available test results for each category.

JDK comparison tests

The following tests compare the performance of 5 different JDKs, running on Linux (CentOS 7.9), on a server with dual Zen 2 CPUs, 16 physical cores each, 512 GB RAM, 300 GB of storage space for the test data. The Apache Spark version is 3.5.0 the test kit is test_Spark_CPU_memory.py. The JDK tested are:

  • Adoptium jdk8u392-b08
  • Adoptium jdk-11.0.21+9
  • Adoptium jdk-17.0.9+9
  • Oracle jdk-17.0.9
  • Oracle graalvm-jdk-17.0.9+11.1

The openJDKs were downloaded from Adoptium Temurin JDK, the Oracle JDKs were downloaded from Oracle JDK.
The Adoptium Temurin OpenJDK are free to use (see website).

Notably, the Oracle download page also reports that the JDK binaries are available at no cost under the Oracle No-Fee Terms and Conditions, and the GraalVM Free Terms and Conditions, respectively, see Oracle's webpage for details.


Test results and measurements

Test results summarized in this table are from the test output files, see Data. The values reported here are taken from the test reports, measured at the 3rd run of each test, as the run time improves when running the tests a couple of times in a row (as internal structures and caches are warming up, for example), The results are further averaged over the available test results (6 test runs) and reported for each category.

JDK and Metric name OpenJDK Java 8 OpenJDK Java 11 OpenJDK Java 17 Oracle Java 17 GraalVM Java 17
JDK Adoptium jdk8u392-b08 Adoptium jdk-11.0.21+9 Adoptium jdk-11.0.21+9 Oracle jdk-17.0.9 Oracle graalvm-jdk-17.0.9+11.1
Elapsed time (sec) 45.4 39.3 42.0 41.9 34.1
Executors' cumulative
... run time (sec)
896.1 775.9 829.7 828.6 672.3
... CPU time (sec) 851.9 763.4 800.6 796.4 649.5
... Garbage Collection time (sec) 42.6 12.3 29.4 32.5 23.0


Performance data analysis

From the metrics and elapsed time measurements reported above, the key findings are:

  • Java 8 has the slowest elapsed time, Java 11 and 17 are about 10% faster than Java 8, GraalVM is about 25% faster than Java 8.
  • The workload is CPU bound.

The instrumentation metrics provide additional clues on understanding the workload and its performance:

  • Run time, reports the cumulative elapsed time for the executors
  • CPU time reports the cumulative time spent on CPU.
  • Garbage Collection Time is the time spent by the executors on JVM Garbage collection, and it is a subset of the "Run time" metric.
  • From the measured values (see table above) we can conclude that the executors spend most of the time running tasks "on CPU", with some time spent on Garbage collection
  • We can see some fluctuations on Garbage Collection time, with Java 8 having the longest GC time. Note that the algorithm G1GC was used in all the tests (its use is set
  • as a configuration by the load generation tool test_Spark_CPU_memory.py).
  • We can see the GraalVM 17 stands out as having the shortest Executors' runtime. We can speculate that is due to the GraalVM just-in-time compiler and the Native Image feature, which provide several optimizations compared to the standard HotSpot JVM (note, before running to install GraalVM for your Spark jobs, please note that there are other factors at play here, including that Native Image feature in an optional early adopter technology, see Oracle documentation for details).
  • Java 8 shows the worst performance in terms of run time and CPU time, and it also has the longest Garbage Collection time. This is not surprising as Java 8 is the oldest of the JDKs tested here, and it is known to have worse performance than newer JDKs.
  • Java 11 and Java 17 have similar performance, with Java 11 being a bit faster than Java 17 (of the order of 3% for this workload), at this stage it is not clear if there is a fundamental reason for this or the difference comes from measurement noise (see also the section on "sanity checks" and the comments there on errors in the metrics measurements).

Active benchmarking and sanity checks

The key idea of active benchmarking is that while the load testing tool is running, we also take several measurements and metrics using a variety of monitoring and measuring tools, for OS metrics and application-specific metrics. These measurements are used to complement the analysis results, provide sanity checks, and in general to help understand the performance of the system under test (why is the performance that we see what it is? why not higher/lower? Are there any bottlenecks or other issues/errors limiting the performance?).

Spark tools: the application-specific instrumentation used for these tests were the Spark WebUI and the instrumentation with sparkMeasure that allowed us to understand the workload as CPU-bound and to measure the CPU time and Garbage collection time.

Java FlameGraph: Link to a FlameGraph of the execution profile taken during a test run of test_Spark_CPU_memory.py. The FlameGraph shows that the workload is CPU-bound, and that the time is spent in the Spark SQL code, in particular in the Parquet reader. FlameGraphs are a visualization tool for profiling the performance of applications, see also Tools_FlameGraphs.md.

OS Tools: (see also OS monitoring tools): Another important aspect was to ensure that the data was cached in the filesystem cache, to avoid the overhead of reading from disk, for this tools like iostat and iotop were used to monitor the disk activity and ensure that the I/O on the system was minimal, therefore implying that data was read from the filesystem cache.
A more direct measurement was taken using cachestat, a tool that can be found in the perf-tools collection and bcc-tool, which allows measuring how many reads hit the filesystem cache, we could see that the hit rate was 100%, after the first couple of runs that populated the cache (and that were not taken in consideration for the test results).
CPU measurements were taken using top, htop, and vmstat to monitor the CPU usage and ensure that the CPUs were not saturated.

Other sanity checks: were about checking that the intended JDK was used in a given test, for that we used top and jps, for example.
Another important check is about the stability of the performance tests' measurements. We notice fluctuations in the execution time for different runs with the same parameters, for example. For this reason the load-testing tool is run on a local machine rather than a cluster, where these differences are amplified, moreover the tests are run multiple times, and the results reported are averages. We estimated the errors in the metrics measurements due to these fluctuations to be less than 3%, see also the raw test results reported available at Data.

Related work

The following references provide additional information on the topics covered in this note.

Conclusions

This blog post presents an exploration of load methodologies using Apache Spark and a custom CPU and memory-intensive testing toolkit. The focus is on comparing different JDKs and producing insights into their respective performance when running Apache Spark jobs under specific conditions (CPU and memory-intensive load when reading Parquet files). Upon evaluating Apache Spark's performance across different JDKs in CPU and memory-intensive tasks involving Parquet files, several key findings emerged:

  1. JDK's Impact: The chosen JDK affects performance, with significant differences observed among Java 8, 11, 17, and GraalVM.
  2. Evolution of JDKs: Newer JDK versions like Java 11 and 17 showcased better outcomes compared to Java 8. GraalVM, with its specific optimizations, also stood out.
  3. Developer Insights: Beyond personal preference, JDK selection can drive performance optimization. Regular software updates are essential.
  4. Limitations: Our results are based on specific test conditions. Real-world scenarios might differ, emphasizing the need for continuous benchmarking.
  5. Guidance for System Specialists: This study offers actionable insights for architects and administrators to enhance system configurations for Spark tasks.

In essence, the choice of JDK, coupled with the nature of the workload, plays a significant role in Apache Spark's efficiency. Continuous assessment is crucial to maintain optimal performance.


Acknowledgements

I would like to express my sincere gratitude to my colleagues at CERN for their invaluable assistance and insightful suggestions, in particular I'd like to acknowledge the CERN data analytics and web notebook services, and the ATLAS database and data engineering teams.


Thursday, June 22, 2023

Building a Semantic Search Engine and RAG Applications with Vector Databases and Large Language Models

This blog post is about building a getting-started example for semantic search using vector databases and large language models (LLMs), an example of retrieval augmented generation (RAG) architecture. You can find the accompanying notebook at this link. See also the SWAN gallery.

CERN users can run the notebooks using the SWAN platform and GPU resources. SWAN

Other options for running the notebooks in the cloud with a GPU include Google's Colab.   Open In Colab


Goals and Scope

Our primary goal is to demonstrate the implementation of a search engine that focuses on understanding the meaning of documents rather than relying solely on keywords.

The proposed implementation uses resources currently available to CERN users: Jupyter notebooks with GPUs, Python packages from the open source ecosystem, a vector database.

Limitations:it's important to note that this example does not cover building a fully-fledged search service or chat engine. We leave those topics for future work, here were limit the discussion to a getting-started example and a technology demonstrator. 


Understanding Key Concepts

Semantic search: Semantic search involves searching for meaning rather than just literal matches of query words. By understanding the context and intent behind the query, semantic search engines can provide more accurate and relevant results.  

Vector Database: A vector database is a specialized type of database designed to handle vector embeddings. These embeddings represent data in a way that captures essential semantic information. They are widely used in applications such as large language models, generative AI, and semantic search.  

Large Language Models (LLMs): LLMs are powerful language models built using artificial neural networks with a vast number of parameters (ranging from tens of millions to billions). These models are trained on extensive amounts of unlabeled text data using self-supervised or semi-supervised learning techniques.  


Implementation details

Building a semantic search prototype has become more accessible due to recent advancements in natural language processing and applied ML/AI. Using off-the-shelf components and integrating them effectively can accelerate the development process. Here are some notable key ingredients that facilitate this implementation:

  • Large Language Models (LLMs) and embedding Libraries
    • The availability of powerful LLMs such as OpenAI GPT-3.5 and GPT-4, Google's Palm 2, and of embedding libraries, significantly simplifies the implementation of semantic search and natural language processing in general. These models provide comprehensive language understanding and generation capabilities, enabling us to extract meaning from text inputs.
  • Platforms: 
    • Platforms and cloud services such as Hugging Face offer valuable resources for operating with ML models as these libraries provide pre-trained models, tokenization utilities, and interfaces to interact with LLMs, reducing the implementation complexity.
  • Open Source Libraries like LangChain:
    • Open source libraries like LangChain provide a convenient way to integrate and orchestrate the different components required for building applications in the semantic search domain. These libraries often offer pre-defined pipelines, data processing tools, and easy-to-use APIs, allowing developers to focus on the core logic of their applications.
  • Vector Databases  and Vector Libraries:  
    • Vector libraries play a crucial role in working with semantic embeddings. They provide functionalities for vector manipulation, similarity calculations, and operations necessary for processing and analyzing embedding data. Additionally, vector databases are recommended for advanced deployments, as they offer storage and querying capabilities for embeddings, along with metadata storage options. Several solutions are available in this area, ranging from mature products offered as cloud services to open source alternatives.

Back-end: prepare the embeddings and indexes in a vector database

To ensure factual accuracy and preserve the original document references, we will prepare the embeddings and indexes in a vector database for our semantic search query engine. Additionally, we aim to enable indexing of private documents, which necessitates storing the embeddings rather than relying on the LLM model directly.

Transforming document chunks into embedding vectors is a crucial step in the process. There are specialized libraries available that utilize neural networks for this task. These libraries can be accessed as cloud services or downloaded to run on local GPU resources. In the accompanying notebook, you can find in the accompanying notebook an example demonstrating this process. 

A second import part is about storing the embeddings. For this a vector library or a vector database can be quite useful. A library like FAISS is a good idea is you have a small amount of documents and/or are just prototyping. A vector DB can provide more features than a simple library, in particular when handling large amounts of documents. In the accompanying notebook we use the FAISS library and, as alternative option, OpenSearch k-NN indexing. Note that several other vector database products can be readily "substituted" to offer comparable and, in some cases, extended functionality.

Note: CERN users have the option to contact the OpenSearch service to request an instance of OpenSearch equipped with the plugin for k-NN search. This can be a valuable resource for your semantic search implementation.


Figure 1: A schematic diagram of how to prepare a set of documents for semantic search. The documents are split in chunks, for each chunk embeddings are computed with a specilized library and then stored in a vector database.

When using FAISS as the Vector library, this is how embedding and indexing can be done:


This is the equivalent code when using OpenSearch as Vector DB:


Semantic querying using similarity search and vector DB indexes


This uses a key functionality of vector libraries and vector databases: similarity search. The general idea is to create a vector embedding for the query and find in the database of embedded vectors the closest elements to the query. For large document collections this can be slow, so vector libraries and databases implement specialized indexes and algorithms for this, for example approximate k-nearest neighbors search.

Figure 2:  A diagram of the similarity query process. The query is converted into embeddings and similarity search via the specialized indexes is performed using a vector database or vector library. Algorithms such as k-nearest neighbors are used to find the matching document chunks for the given query.

Semantic search provides a list of relevant documents for a user query, list the page and text chunk reference, as in this example:


Grand Finale: a Large Language Model for natural language query capabilities


Semantic search returns a list of relevant document snippets, as the last (optional) step we want to convert that into a coherent text answer. For this we can use LLM models. The technique is simple, we just need to feed the query and the relevant pieces of text to the LLM and then take the answer from the model. For this we need to use a rather sophisticated LLM model. The best ones currently work as cloud services (some are free and some charge per use), other models available for free download currently require rather powerful GPUs to run locally.

This is the final result: a system capable of querying the indexed text(s) using natural language. In the following example we apply it to replying to queries about the future of LHC computing, based on the document A Roadmap for HEP Software and Computing R&D for the 2020s


Conclusions

In this blog post, we have demonstrated how to build a beginner's semantic search system using vector databases and large language models (LLMs). Our example has utilized Jupyter notebooks with GPUs, Python packages, and a vector database, proving that a semantic search engine that queries documents for meaning, instead of just keywords, can be feasibly built using existing resources.

In our implementation, we demonstrated how embeddings and indexing can be performed using FAISS as the vector library, or in alternative with OpenSearch as the vector database. We then moved onto the semantic query process using similarity search and vector DB indexes. To finalize the results, we utilized an LLM to convert the relevant document snippets into a coherent text answer.

Though the example provided is not intended to function as a fully-developed search service, it serves as an excellent starting point and technological demonstrator for those interested in semantic search engines. Additionally, we acknowledge the potential of these methods to handle private documents and produce factually accurate results with original document references.

We believe the combination of semantic search, vector databases, and large language models holds large potential for transforming how we approach information retrieval and natural language processing tasks.

The accompanying notebook, providing step-by-step code and more insights, is accessible on GitHub and via the CERN SWAN Gallery. For researchers and developers interested in delving into this exciting area of applied ML/AI, it offers a working example that can be run using CERN resources on SWAN, and also can run on Colab.


Acknowledgements

I would like to express my sincere gratitude to my colleagues at CERN for their invaluable assistance and insightful suggestions, in particular I'd like to acknowledge the CERN data analytics and web notebook services, the OpenSearch service, and the ATLAS database and data engineering teams. Their expertise and support have played a crucial role in making this collection of notebooks possible. Thank you for your contributions and dedication.

Thursday, June 1, 2023

Exploratory Notebooks for Deep Learning, AI, and Data Tools: A Beginner's Guide

Are you looking at some resources to get you up to speed with popular Deep Learning and Data processing frameworks? This blog entry provides a curated collection of notebooks that will help you kickstart your journey.

You can find the notebooks at this link. See also the SWAN gallery.

CERN users can run the notebooks on the SWAN platform, using GPU resources. SWAN

Other options for running the notebooks in the cloud with a GPU include Google's Colab.  Open in Colab


Getting started with Deep Learning

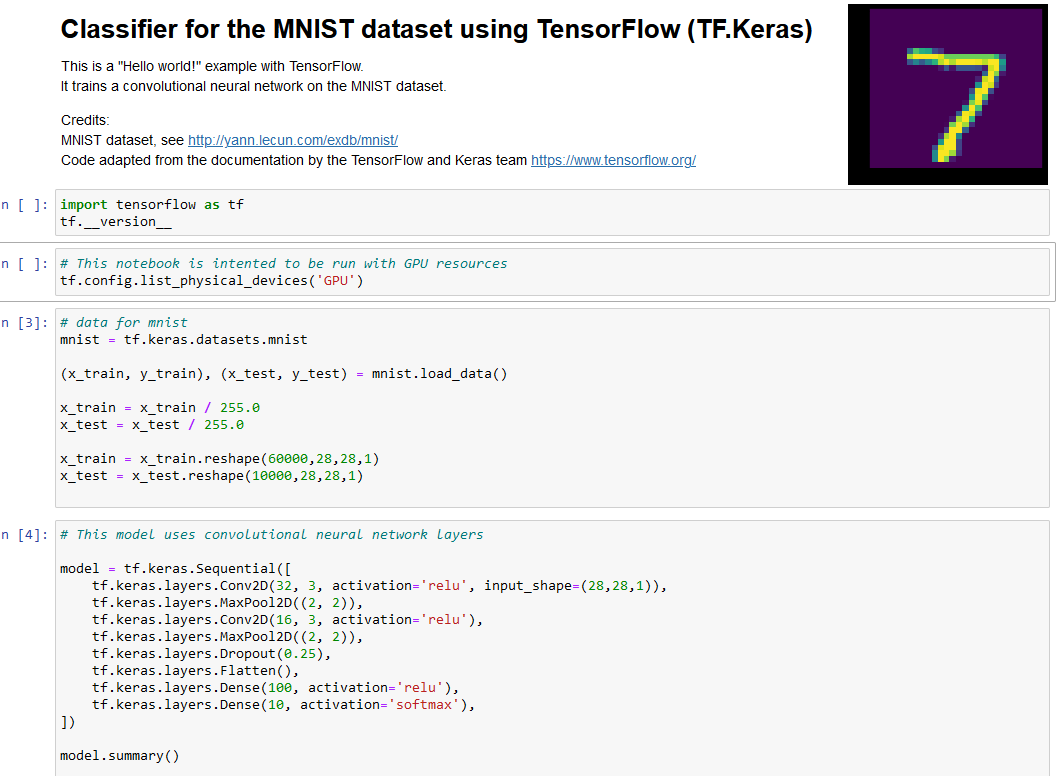
These notebook showcase a digit recognition classifier using the MNIST dataset, which serves as a "Hello World!" for Deep Learning. Choose from the following options to get started:


Deep Learning and basic Data pipelines

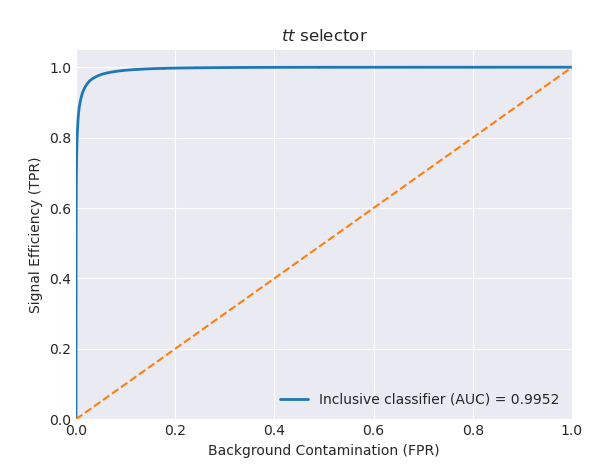
Learn how to integrate Deep Learning frameworks with basic data pipelines using Pandas to feed data into the DL training step. These notebooks implement a Particle classifier using various DL frameworks. The data is stored in Parquet format, offering efficient data reading. 


More advanced Data pipelines

Take your data processing skills to the next level with these notebooks, which demonstrate advanced data pipelines suitable for large datasets. Discover how to leverage the Petastorm library to read data from Parquet files with TensorFlow and PyTorch, as well as utilizing the TFRecord format with TensorFlow.


Additional complexity with models and data

Building upon the previous examples, these notebooks introduce more complex models and larger datasets for the Particle classifier. Explore the capabilities of TensorFlow, GRU, Transformer, and TFRecord with:


AI Tools Examples

This section contains Jupyter notebook examples of AI tools, including LLMs, Transformers, vector databases. The notebooks are intended to be run using GPU resources.

Transformers library

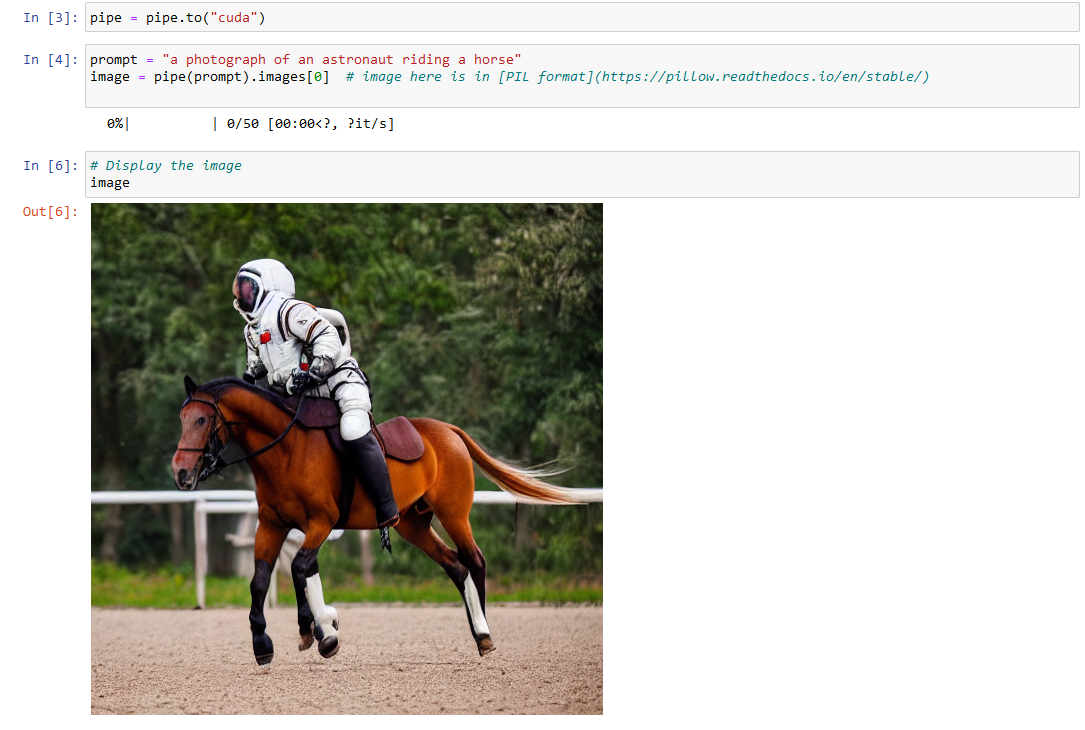
Explore the powerful Transformers library from Hugging Face, widely used for LLM, Natural Language Processing (NLP), image, and speech tasks.


Large language models

These notebooks provide examples of how to use LLMs in notebook environments for tests and prototyping


Semantic search with Vector Databases and LLM

Semantic search allows to query a set of documents. This examples shows how to create vector embeddings, store them in a vector database, and perform semantic queries enhanced with LLM.


Data Tools Examples

This section offers example notebooks featuring popular frameworks and libraries for handling data. Please note that it does not cover scale-out data solutions such as Spark and Dask.

For Apache Spark see SparkTraining

If you require access to relational databases for testing, CERN users can reach out to Oracle and DBOD services. You can also set up test databases using container technology. Here's how:

Running a test Oracle instance on a container:

  • Run Oracle Free on a container from gvenzl dockerhub repo https://github.com/gvenzl/oci-oracle-free
    • see also https://github.com/gvenzl/oci-oracle-free
    • docker run -d --name mydb1 -e ORACLE_PASSWORD=oracle -p 1521:1521 gvenzl/oracle-free:latest
    • Wait until the DB is started (this may take a few minutes). Check progress with: docker logs -f mydb1
    • install the Python library for connecting to Oracle: pip install oracledb

Setting up a PostgreSQL instance for testing using a Docker image:

  • docker run --name some-postgres -p 5432:5432 -e POSTGRES_PASSWORD=mysecretpassword -d postgres
  • wait till the DB is started, check logs at: docker logs -f some-postgres
  • install the Python library for connecting to PostgreSQL: pip install psycopg2-binary

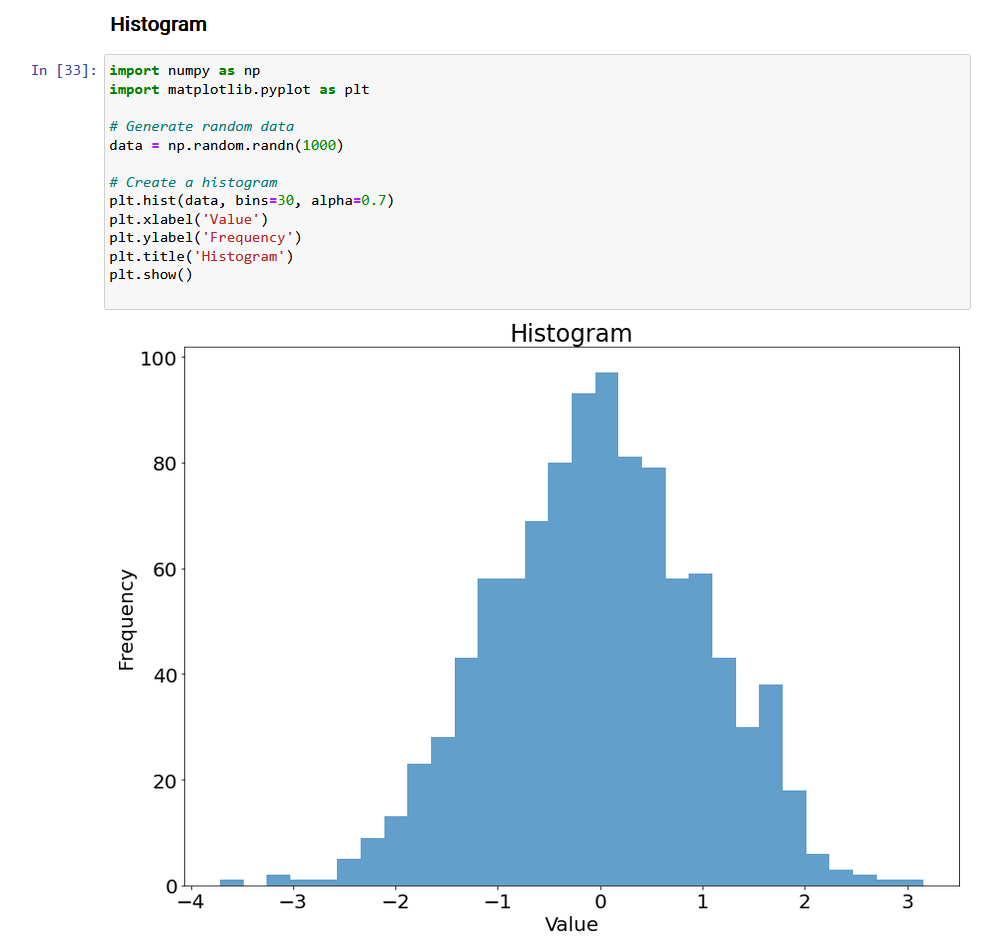
Pandas and numpy examples


Conclusions and acknowledgments

This blog entry provides a valuable collection of exploratory notebooks for individuals who are new to deep learning and data processing. With a focus on popular frameworks and libraries, these notebooks cover a range of topics including digit recognition, transformers for various tasks, integrating deep learning with data pipelines, advanced data processing techniques, and examples of data tools. Whether you are a CERN user or prefer cloud-based platforms like Google's Colab, these notebooks will help you quickly grasp the fundamentals and get started on your deep learning and data processing journey.

I would like to express my sincere gratitude to my colleagues at CERN for their invaluable assistance and insightful suggestions, in particular I'd like to acknowledge the CERN data analytics and web notebook services and ATLAS database and data engineering teams. Their expertise and support have played a crucial role in making this collection of notebooks possible. Thank you for your contributions and dedication.


Thursday, May 4, 2023

CPU Load Testing Exercises: Tools and Analysis for Oracle Database Servers

This document describes some basic CPU load testing exercises on three different types of database servers used by the Oracle Service at CERN. It reports on the tests performed, tools used for data gathering, data analysis, findings, and lessons learned.

Motivations

CPU usage is important for data processing: We observe that workloads on Oracle database services at CERN are often CPU-bound. Database workloads for transactional processing perform many random read operations. In the past, this mostly stressed the I/O subsystem, these days we deploy databases with large buffer caches (400 GB or more of data block caches) and most operations are CPU bound, reading data from buffer cache.

Server consolidation, quality of service and licensing: We deploy on commodity HW considering various constraints: striking a balance between consolidating workloads and isolating critical workloads from different users’ communities. Moreover, Oracle licensing costs, which are proportional to the deployed CPUs, play a key input in the efforts streamlining the CPU deployments across the DB service. 


Description and limitations of the tests

The tests reported here are extremely limited in scope, as they focus only on CPU performance and with two specific and “narrow” workloads. However, I believe they provide some indications on the behavior of the server CPU performance and the overall CPU capacity of the installed servers. The comparison between three different server models is the original motivation of this work as we wanted to understand how newer model can be deployed to replace old ones. This work is not a benchmark of the tested systems. 


Tools used for load testing

The first workload generator and testing tool is a simple script burning CPU cycles in a loop and executed using multiple workers running in parallel, two implementations have been used, one in Python and one in Rust compiled to binary. Both provide similar results.

The second workload generator is SLOB a tool that runs on top of Oracle databases for testing and specifically stresses “Logical IO”, that is reading blocks from the Oracle buffer cache (memory).

Links to the code, measured data, and data analyses using notebooks:

CPU load testing kit - Python version

Kit for load testing and measuring CPU-intensive workloads, Python version.

CPU load testing kit - Rust version

Kit for Load testing and measuring CPU-intensive workloads, Rust version.

Oracle CPU load testing using SLOB

Load testing Oracle using the SLOB test kit.


Key findings

-          RAC55 is the newest server model of the three tested and shows the highest CPU per-thread performance and highest CPU total throughput at saturation.

-          RAC55 has about 2.0x single-thread performance increase compared to RAC52.

-          RAC55 has about 1.5x single-thread performance increase over RAC54, but this is valid only for low load, as RAC54 has only 8 physical cores vs 16 cores in RAC55. Moreover, RAC54 provides considerably less total CPU throughput compared to RAC52 and RAC55.

-          RAC55 has about 2.0x more total CPU throughput at saturation compared to RAC52 despite having only 16 physical cores compared to 20 physical cores in RAC52.


Description of the platforms

CPU load tests have been performed on three dedicated test servers representative of the production database servers in March 2023: RAC52, RAC54, and RAC55.

The servers were installed with RHEL 7.9 and Oracle tests used Oracle 19c (v. 19.17). We omit the configuration of networking and I/O, as not relevant for these tests. We don't report the exact CPU models in this doc.


RAC52 configuration:

  • 20 physical cores (2 sockets, 10 physical cores each), 40 logical cores visible on the OS due to hyperthreading
  • CPU nominal frequency: 2.20 GHz
  • CPU from 2016, L1 caches: 32K + 32K, L2 cache 256K, L3 cache 25600K
  • RAM: DDR4, 512 GB


RAC54 configuration:

  • 8 physical cores (2 sockets, 4 physical cores each), 16 logical cores visible on the OS due to hyperthreading
  • CPU nominal frequency: 3.80 GHz
  • CPU from 2019, L1 caches: 32K + 32K, L2 cache 1024K, L3 cache 16896K
  • RAM: DDR4, 768 GB


RAC55 configuration:

  • 16 physical cores (2 sockets, 8 physical cores each), 32 logical cores visible on the OS due to hyperthreading
  • CPU nominal frequency: 3.7 GHz
  • CPU from 2019, L1 caches: 32K + 32K, L2 cache 512K, L3 cache 32768K
  • RAM: DDR4, 1 TB


Test 1 – Concurrent workers burning CPU cycles in a loop and in parallel


The workload generator and testing tool is a simple Python script burning CPU cycles in a loop.

The script is executed running on a configurable number of concurrent workers. The script measures the time spent executing a simple CPU-burning loop.

This provides a simple way to generate CPU load on the system.

Example of how the data was collected with the testing tool written in Rust and compiled to binary:

./test_cpu_parallel --num_workers 8 --full --output myout.csv


See the code at this link 

The advantage of this approach is that the testing tool is easy to write and can be easily automated.

The weak point of testing this way is that the test workload is somewhat “artificial” and disconnected with the server actual purpose as a DB server. For example, the CPU-burning loop used for this test is mostly instruction-intensive on the CPU and does not spend much time on memory access.


Measurements and results:

See also Data and Notebooks at this link

The following figures represent the same data in different ways to highlight different performance and scalability characteristics.


Figure 1 – Raw data

-          The figure reports the testing job execution time, measured for varying server load on the three tested servers.

-          A common pattern is that at low load (see data with just a few parallel workers) the job run time is almost constant.

-          An important difference is that the job run time is different on the different platforms, in order of increasing performance: RAC52, RAC54, RAC55 (the newest server and the fastest).

-          Another pattern is that the job running starts to increase linearly at higher load.

-          The job execution time curve starts to bend upwards as the load increases. Typically, we see this happening when the num of parallel workers is greater than the number of physical cores on the server (20 cores on RAC52, 8 cores on RAC54 and 16 cores on RAC55)


Figure 2 - Speed

-          This plot reports the number of jobs per minute per worker

-          Data points can be interpreted as a measure of the “speed of the CPU” for a new job coming into the system given a defined system load

-          We see that the “effective CPU speed” decreases as the load increases, with sudden changes at the points where the number of parallel workers is equal to the number of physical cores

-          The CPU speed per thread is also different depending on the CPU architecture, in order of increasing performance: RAC52, RAC54, RAC55 (the newest server and the fastest).


Figure 3 - Capacity

-          This plot shows the number of jobs executed per minute summed over all the running worker threads.

-          As the load increases the server capacity increases, reaching a maximum value at number of workers = number of logical cores (40 for RAC52, 8 for RAC54, 32 for RAC55)

-          This allows to compare the “Total CPU capacity” of the three servers. In order of increasing capacity: lowest capacity with RAC54 (the server with fewer cores), then RAC52, finally RAC55 has the highest CPU throughput (it’s the newest server)


Figure 4 - Scalability

-          This shows the speedup, a measure of scalability. For the scope of this plot, speedup is calculated as N * (job execution time at load n) / (job execution time at load 1)

-          We see almost linear scalability for low loads (up to the number of physical cores), then a slower increase up to the number of logical cores, and, eventually, the speedup reaches saturation

-          RAC54 and RAC55 appear to scale almost linearly up to the number of physical cores (respectively 8 and 16)


Notes:

-          Of the tested servers RAC55 appears the fastest on per-thread CPU performance at low and high loads and the one with higher CPU capacity.

-          The difference in performance between RAC52 (oldest) and RAC55 (newest) is roughly x1.5 in per-CPU thread performance and x2 in overall CPU capacity at high load.

-          RAC54 performs similarly to RAC55 but only at low loads (<= 8 concurrent workers)


Test 2 – Parallel workers running “SLOB tests”, measuring Oracle logical IO throughput


The second workload generator is SLOB, a tool by Kevin Closson, that runs on top of Oracle databases for load testing and specifically stresses Physical and Logical IO. In the configuration used for these tests we only stressed Logical IO, that is accessing blocks from the Oracle buffer cache (memory).

The tool creates test tables on the database and performs block IO reading from the test tables with a tunable number of concurrent workers.

See also the official SLOB page.

The Oracle database used for testing was configured with a large SGA (Oracle’s shared memory area),  able to cache the test tables in the Oracle buffer cache. The test workload was therefore stressing Oracle’s “Logical IO”, that is the part of the Oracle internal code that takes care of reading data blocks from the buffer cache (Oracle’s consistent read operations). Minimal additional operations were performed on the blocks accessed this way by SLOB. Logical IO is an operation with duration of the order of 1 microsecond during these tests. Notably, it includes time for Oracle-internals operations and serialization needed for reading data from the Oracle buffer cache, and finally the Oracle-internals code for reading the block header. The SLOB Logical IO test workload does not appear to saturate the CPU-memory channel on the tested servers (for example on RAC55, using OS tools we could see the CPU-memory bandwidth being utilized during SLOB logical I/O tests went up to 40 GB/s, while using memory-intensive load generators the system could scale at least up to 220 GB/s,see also Tools_Linux_Memory_Perf_Measure.

Standard Oracle instrumentation, notably SQL*Plus (Oracle’ CLI tool) and AWR reports (Oracle’s performance report), was used to collect the number of Logical I/Os recorded during the test and for other sanity checks, notably checking that the test workload was fully reading from memory rather than performing Physical I/O.

SLOB test tables have been created with size 16 GB per user, each concurrent worker running on a dedicated user. Tests for load higher than 16 concurrent users have used 8 GB test tables per user. The Oracle buffer cache for testing was allocated using Linux large pages, as it is recommended by Oracle, and was 400 GB in size, therefore large enough to cache all the test data. We took care of caching Oracle tables' data with a couple of executions of the test workload before starting to measure Logical I/O performance. The fact that Oracle was not performing Physical I/O during the tests was also double-checked using monitoring tools and by inspection of the AWR reports.

The advantage of this approach is that this is stressing the system on a key operation for the Oracle DB workloads that are CPU-bound: Oracle RDBMS Logical I/O.

These tests take longer to run the simple “Tests with a CPU-burning script” described above, moreover they require some Oracle DBA expertise to configure and validate the test results.


Measurements and results:

The following figures represent the same data in different ways to highlight different performance and scalability characteristics.

Data with the graphs on Notebooks at this link


Figure 5 – Raw Data and Capacity

-          The figure shows how the cumulative Oracle logical IO throughput increases with the number of parallel workers for the three servers tested.

-          The common trend is that the Logical IO throughput increases with load up to the number of logical CPUs (16 for RAC54, 32 for RAC55, and 40 for RAC52).

-          Measurements are “noisy” so we should take about 10% as the error margin on the collected data points.

-          There are differences in performance and total throughput with RAC55 being the most performance and with the highest throughput.

-          At low load, (<= 8 concurrent processes) RAC54 and RAC55 have similar performance.

-          At high load, RAC55 has about 20% more capacity/throughput of Logical IO than RAC52.


Figure 6 - Speed

-          The figure shows Oracle logical IO throughput per worker as function of load.

-          The performance of logical IOs decays with increasing load.

-          Logical IO performance appears close to constant up to the number of physical cores of the server (8 for RAC54, 16 for RAC55 and 20 for RAC52) and then decays for higher load, saturating when the number of logical cores is reached.

-          Measurements are “noisy” so we should take about 10% as the error margin on the collected data points.

-          RAC55 shows the highest performance overall for Logical I/O throughput.

-          At load below 16 concurrent workers, RAC55 appears 1.5x faster than RAC52, the gap closes to about 20% at high load.


Figure 7 - Scalability

-          The figure shows speedup as function of load.

-          The figure shows the speedup, a measure of scalability, for this plot it’s calculated as the ratio of (cumulative Logical I/O at load n) / (cumulative Logical I/O at load 1)

o   Linear scalability would be represented by a line with speedup = number of parallel workers.

-          A general trend observed in the data is that the scalability curves start close to the ideal linear scalability and then bend downwards due to contention.

-          RAC55 has the better scalability behavior of the three servers tested. At low load (less than 8 concurrent workers) RAC55 and RAC54 have similar behavior.


Conclusions

This work collects a few tests and measurements on stress testing and CPU loading on three different platforms of interest for the CERN Oracle database service.

The tests performed are narrow in scope, just addressing the CPU load.

Two different testing tools have been used for these tests: testing with a simple CPU-burning script loop run in parallel, and testing with an Oracle-specific workload generator for Logical I/O. 

The tools used, as well as the measured data and their analyses, are available at this link.

We find that the newest server model (RAC55) has the highest CPU per-core performance, scalability, and overall CPU throughput.

This work has been done in the context of the CERN databases and analytics services and the ATLAS data engineering efforts, many thanks to my colleagues for their help and suggestions.