Spoiler alert: For quantitative analysis of storage performance and in particular for measuring random read I/O in Oracle, I'd rather advise the use tools that allow generating test workloads in a controlled manner, in a way that can be understood and measured and in particular with latency details together with IOPS measurements. For example SLOB by Kevin Closson is an excellent tool that I have happily used in several occasions for this purpose (see also this example). Kyle Hailey has also written on the topic of storage testing, see for example this. Brendan Gregg has written on the advantages of using the active benchmarking method.
What is DBMS_RESOURCE_MANAGER.CALIBRATE_IO?
From the Oracle performance tuning manual: "The I/O calibration feature of Oracle Database enables you to assess the performance of the storage subsystem, and determine whether I/O performance problems are caused by the database or the storage subsystem."
This is promising and should definitely catch the DBA's attention. At a closer look it appears that CALIBRATE_IO can probably be better described as a simplified version of the Oracle ORION testing tool integrated inside the database with the goal of measuring key metrics of the database storage, namely the maximum throughput for read sequential IO and maximum IOPS for random read I/O. CALIBRATE_IO measures only read workload.
DBMS_RESOURCE_MANAGER.CALIBRATE_IO has a few advantages: it is very simple to use, it does not require any additional installation steps, it works in RAC and it produces a simple output.
CALIBRATE_IO attempts to measure random I/O performance with two numbers: maximum number of IOPS and average latency at which it is measured. Unfortunately this can be often misleading for many of the modern storage systems where the IOPS latency distribution is multi-modal, that is we have a fast speed for I/Os served by SSD (or RAM) cache and a slower speed for I/Os served by physical disks.
Another shortcoming is that the workload generated by CALIBRATE_IO 'is a black box', we don't know the details of how the numbers that are reported in the output are measured and how the testing workload is generated. We will investigate CALIBRATE_IO workload in the rest of this article.
How to run CALIBRATE_IO, a sqlplus example:
Let's start with an example on how to run procedure (note the code below will generate high load on the storage for a few minutes, so you will probably want to be careful on where you run it).DECLARE
lat INTEGER;
iops INTEGER;
mbps INTEGER;
BEGIN
DBMS_RESOURCE_MANAGER.CALIBRATE_IO (num_physical_disks=>100, max_latency=>100, max_iops=>iops, max_mbps=>mbps, actual_latency=>lat);
DBMS_OUTPUT.PUT_LINE ('max_iops = ' || iops);
DBMS_OUTPUT.PUT_LINE ('latency = ' || lat);
DBMS_OUTPUT.PUT_LINE ('max_mbps = ' || mbps);
end;
/
Input parameters:
The first input parameter num_physical_disks has been set to 100 in the example. From the documentation this parameter should be set to the "..approximate number of physical disks in the database storage. This parameter is used to determine the initial I/O load for the calibration run". Based on the observation of a few tests, I noticed that the procedure auto-calibrates the load so I confirm that it does not seem to be important to get this value right.
The second input parameter is max_latency: "Maximum tolerable latency in milliseconds for database-block-sized IO requests". For the tests described in this article I have typically used the value 100 (milliseconds). Lower values for this parameter may throttle the test workload as CALIBRATE_IO tries to meet this limit for the average I/O latency.
Output parameters:
The results of the measurements are three output parameters: max_iops, latency, max_mbps, as in the example above. The values are also made available in the view DBA_RSRC_IO_CALIBRATE (based on the underlying table SYS.RESOURCE_IO_CALIBRATE$). Notably an additional output parameter MAX_PMBPS "Maximum megabytes per second of large I/O requests that can be sustained by a single process" is only available in DBA_RSRC_IO_CALIBRATE.
MAX_IOPS and LATENCY output parameters are respectively "Maximum number of I/O requests per second that can be sustained. The I/O requests are randomly-distributed, database-block-sized reads." and "Average latency of database-block-sized I/O requests at MAX_IOPS rate, expressed in milliseconds".
Note: the results of the calibrate job can be deleted form the system with: delete SYS.RESOURCE_IO_CALIBRATE$ (and commit). See also this article by Gwen Shapira where also other oddities of CALIBRATE_IO and its relationship with the use of parallelism are discussed.
Investigations of CALIBRATE_IO workload
In the following we will go through the exercise of investigating the workload from CALIBRATE_IO, taking it as a black box. It will be a simple but instructive way to get to practice some techniques for investigating I/O in Oracle and to further understand what CALIBRATE_IO can do for us and what are its limitations.
- Start calibrate I/O and observe the processes that are executing the workload.
For investigating this I will use a script that queries from V$SESSION or V$ACTIVE_SESSION_HISTORY. For example top.sql and ash.sql that I have described in the article at this link.
The result is that CALIBRATE_IO spawns a certain number of slaves called CS00, CS01,... The CSXX slaves will be spawned on each active Oracle RAC instance. The number of CALIBRATE_IO processes spawned per instance is equal to the value of the parameter CPU_COUNT, at least in the few tests I have run on a few servers with different numbers of CPUs and consequently of CPU_COUNT, ranging from 8 to 32. The number of slaves that are active at a given time however fluctuates over time as the test progresses. Another fact that we can immediately see is that there is a special wait event triggered by CALIBRATE_IO slaves when doing I/O: "Disk file I/O Calibration"
Here below an example taken from a 4-node RAC database:

- What type of I/O is issued by CALIBRATE_IO?
We can investigate this for example by querying GV$IOFUNCMETRIC with a script such as iometric_details.sql that I have also mentioned in the post at this link.
The results is that CALIBRATE_IO first generates random I/O for small block reads on all RAC nodes, then sequential large I/O reads from multiple sessions and nodes, finally sequential large reads using a single session. This behavior is consistent with the documentation and the tool's output.
Here below an example of monitoring CALIBRATE_IO run on a 4-node RAC during the first execution phase (small random I/O reads). We can see that all nodes are performing I/O for small random read and that the grand total of IOPS is about 30K.

Another example here below is from the same 4-node RAC during the second execution phase, we can see that all four nodes are now executing large sequential reads for a grand total of about 2.5 MB/sec.

- How is the I/O distributed across the storage?
The workload from CALIBRATE_IO is a black box, however we can imagine that the tool uses the existing data files for generating the load. We want to confirm that with some direct investigations: we can query GV$IOSTAT_FILE to get the number of single block requests at the start and at the end of the test workload. By calculating the differences we can see which files have been read. The result is that CALIBRATE_IO reads from all the files in the database. Approximately the amount of blocks read that I have measured is proportional to the file size, that is CALIBRATE_IO spreads the load uniformly across the DB files and filesystems used.
An important fact to keep in mind is that if we use more filesystems/storage types for our database files, CALIBRATE_IO will measure all of them at the same time and produce a result that is an average value.
An example of the type of query that we can use to see which files are being read is:

- CALIBRATE_IO is expected to use asynchronous I/O, can we confirm it?
Using Linux strace on a database using ASM storage over block devices, we can see that I/O is performed using the async IO system calls: io_submit and io_getevents. For the random I/O workload reads are of 8KB, for the sequential I/O workload, reads are of 1MB. This was expected.
However we can also see that each CSXX slave of CALIBRATE_IO submits I/Os one by one and then most of the time an io_getevents follows immediately reaping 1 I/O. There are exceptions where larger numbers of I/O are reaped together (for example 128 8K I/Os), this latter case shows the true nature of asynchronous I/O for CALIBRATE_IO.
In the second and third part of the workload, CALIBRATE_IO tests for large sequential reads, in this case we see io_submit calls with a payload of 1MB, as expected.
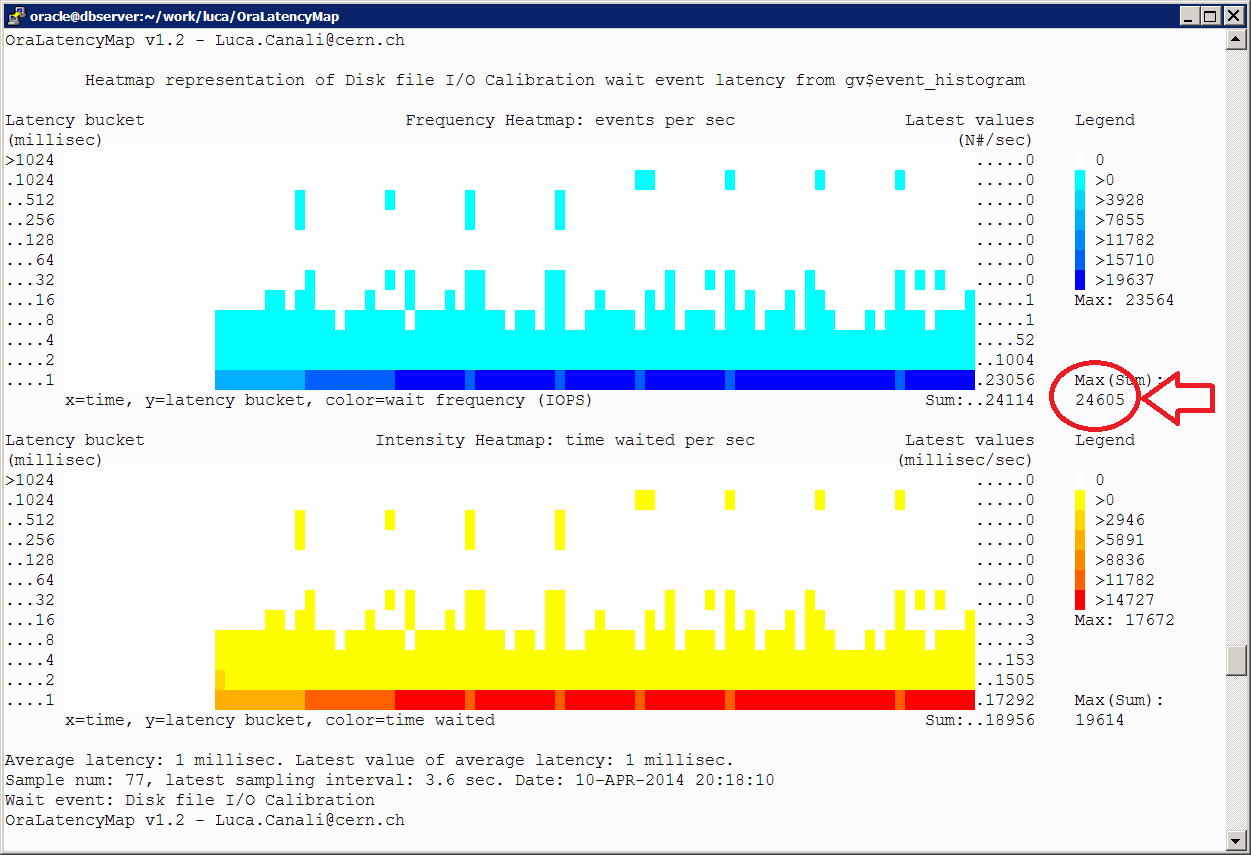
Given the asynchronous nature of the I/O, the latency details for the wait event "Disk file I/O Calibration" do not always give us a precise indication of the I/O service times. In some cases CALIBRATE_IO slaves will issue an I/O and wait till it has been ripped, providing us the service time information as a wait event duration. For high-load tests CALIBRATE_IO may issue many IO requests (typically one by one) but reap them in bunches, as mentioned also in the paragraph above. There the wait event duration becomes uncorrelated with I/O service time. We can see here below an heat map of the waits, where most of the waits appear in the 1ms bucket. This is an artifact of the way Oracle times this wait event (if you are interested in Oracle timing of asynch I/O events, see the excellent investigations by Frits Hoogland in his blog).
These are some key metrics taken during the execution of CALIBRATE_IO for this system with 204 SATA disks, RAC, but running on a single node for this test:
As a reference the result of the CALIBRATE_IO run on the system discussed above with 204 SATA disks in JBOD configuration (Oracle 11.2.0.3 on Linux) was:
max_iops = 24211
latency = 5
max_mbps = 780
The max IOPS number and max MBPS are the expected values. This was a JBOD without any relevant amount of RAM nor SSD cache. The expected value for max IOPS is basically just another way of counting the number of disks (something north of 100 IOPS per disk on this hardware). Also the expected value for sequential I/O is easy to estimate in about 800MB/s (FC HBA, 2 ports at 4Gig each). Therefore the values for max IOPS and max MBPS measured by CALIBRATE_IO for this system agree with expectations.
However, the measured latency value appears to be too small and probably an artifact of using async I/O.
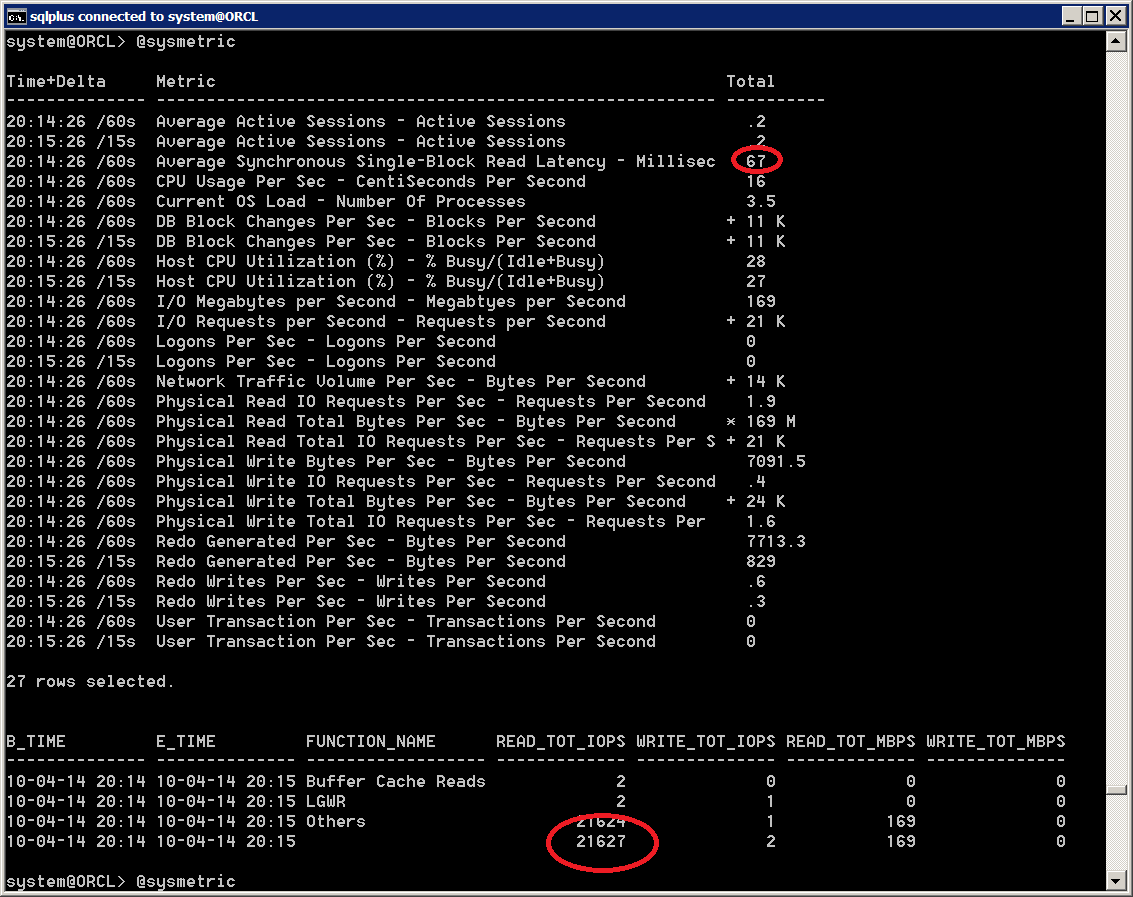
Here below we can see a test performed, on the same system, with SLOB where we get a better drill down of latency and understand what is happening (high latency exposed, effects of saturation due to high load and to aging disks resulting in I/O outliers, etc). IOPS measurements without latency details do not give us the full picture!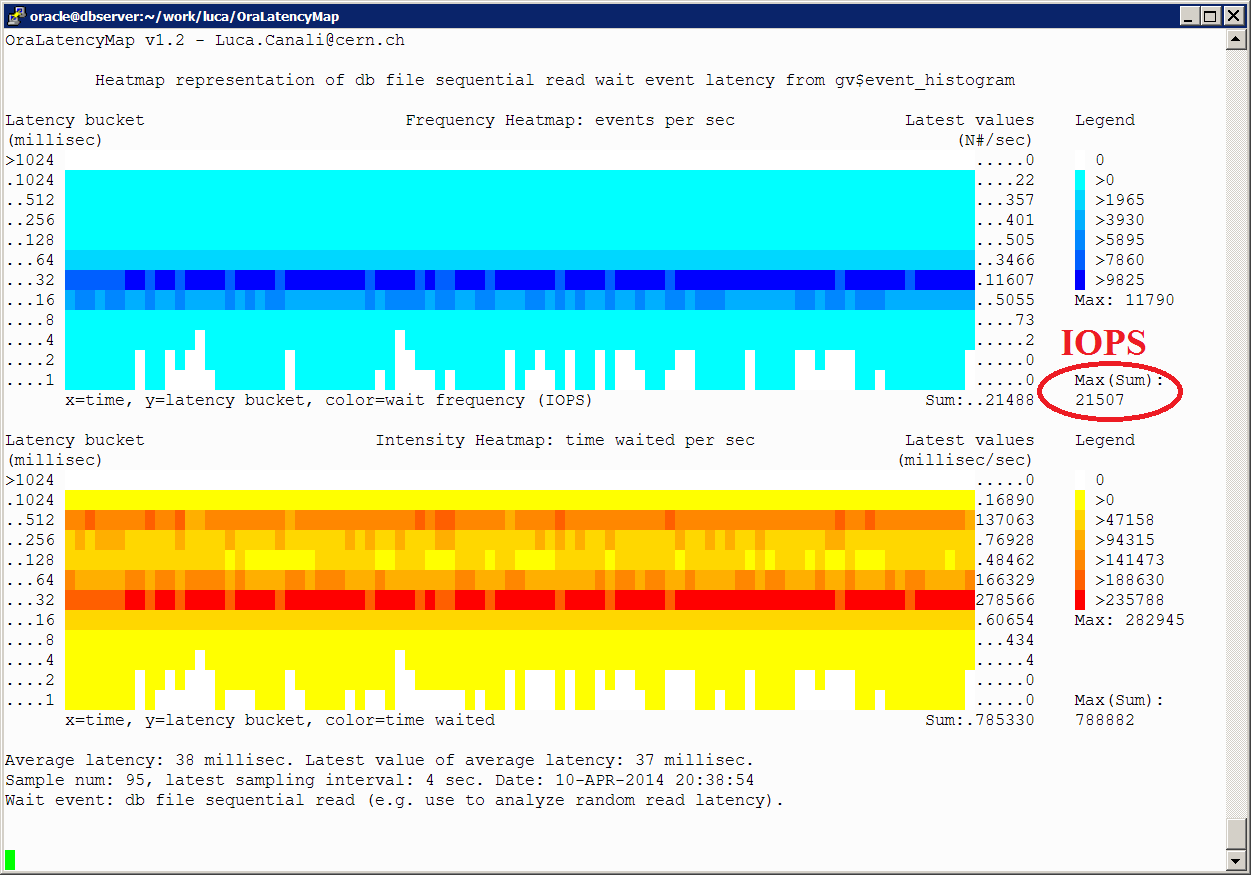
In the figure here below we can see some key metrics taken during the execution of SLOB. In particular note the number of IOPS (21K), which is similar to the previous max IOPS value measured with CALIBRATE_IO. However the average Synchronous IO latency (35 ms on that particular snapshot), is much higher than what reported by CALIBRATE_IO. More details of the measured synch IO latency can be seen in the heatmap above.

- Comments on comparing the two tests for the JBOD case:
The maximum number of IOPS measured when running SLOB turns out to be about the same as what is reported by CALIBRATE_IO for this particular system. This can be explained as the storage system under study is a JBOD and does not have multi-modal response time (there is very little RAM cache and no SSD cache on the storage system, so almost all I/O are served by spindles).
There is an important difference between the results of the two tests and it is with the latency details. Latency tells us many details about how the IO is being served by our storage. By measuring the latency using V$EVENT_HISTOGRAM and plotting is as a heatmap we can see that the system under study suffers from very high latency. It was indeed a very old system with aging disks (being decommissioned, BTW). We did not get the latency details from the CALIBRATE_IO run, which actually told us the average latency was 5ms at 21K IOPS! That would be quite a good result, however it is not the case in the reality and CALIBRATE_IO cannot be trusted on the latency measurement.
- More comments on CALIBRATE_IO and results for other systems types
I have run a few more measurements of CALIBRATE_IO on a NAS system equipped with SSD cache. I have compared the results of CALIBRATE_IO on those systems with values measured when running SLOB, with estimates based on the HW specs, and with estimates based on measurements on similar systems. The results have quite mixed: in some cases CALIBRATE_IO would report a value of max IOPS that was in the range of the expected values, in some other cases it would report a higher values (up to a factor 3 higher).
Latency values have proven once more to be quite important and possibly a key to understand what is happening: in the cases where max IOPS values were above the expected value, the reported latency was very low, the measured latency was reported to be 0 in some cases!
What is likely to happen is that the SSD cache of the controller is being exercised and CALIBRATE_IO does not realize that.
In conclusion for the tests run on NAS storage with SSD cache, CALIBRATE_IO cannot be trusted on the measurement of IOPS and latency.
Also the measurement of the maximum throughput for sequential I/O on this systems have been consistently below the expected value. We expect 1 GB/sec of maximum sequential I/O throughput for this HW, this is confirmed by some simple tests with parallel query, however in most cases CALIBRATE_IO would report only about 500 MB/sec and therefore for this system it cannot be trusted on the measurement of sequential I/O throughput.
In this post we have investigated the use of CALIBRATE_IO to produce I/O intensive workloads for testing storage for Oracle read workloads. CALIBRATE_IO is an easy tool to use and allows to get started with testing very quickly. However CALIBRATE_IO fails to produce accurate results in many circumstances. In particular some important shortcomings of CALIBRATE_IO are: the workload is a black box, we cannot easily scale up the load and understand the effects of storage RAM or SSD cache in the results, it does not provide a latency breakdown of the I/O, therefore hiding some critical details on the storage behavior. Moreover the results of the measured max IOPS, max MBPS and the provided latency values are not always accurate. Finally, by design CALIBRATE_IO will only measure a single value of max IOPS and this can be misleading for storage system with multi-modal response times (such as storage based on disks for capacity but with large amounts of SSD cache).
See also additional links to tools and methods for storage performance studies provided in the first part of the article.