Monday, April 30, 2012

Of I/O Latency, Skew and Histograms 2/2

Case: This is part 2/2 of a performance investigation. In the previous part we have seen how the sudden increase of single block read latency would harm performance of the production database and how this would appear consistently when taking backups.

Drill down questions: what causes the high latency for single block reads during backup? Why do the sequential IO of the backup causes random reads to slow down? Are disks saturating? Is it an Oracle issue or more a storage issue? Finally, what can be done about it?

Oracle event histogram: Oracle instrumentation of wait events provides additional information in terms of histograms. Wait duration is divided in intervals and for each interval we can see how many wait events have happened. Historical data is collected and visible in AWR.

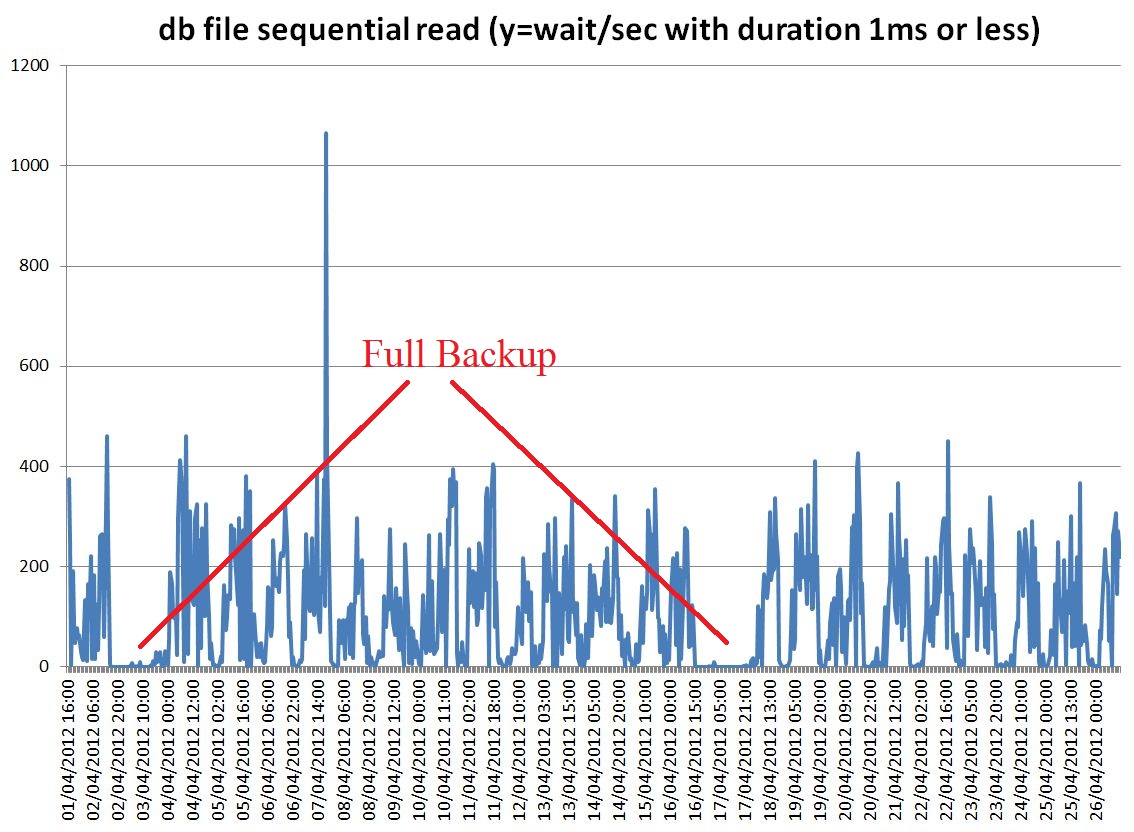
AWR data: Graph of data from DBA_HIST_EVENT_HISTOGRAM for the event db file sequential read are reported here below. In particular we can see that read of 1ms or less, that is reads served by the SSD cache of the storage, go to zero during the time backups are taken. Moreover wait of long duration (between 64 and 128 ms, which is a very long time for single block reads) show a peak at the same time.


Graph1: "Number of single block reads of 64 ms or more (that is very slow)" plotted as function of time. Large peaks are seen in correspondence of full backups (every 2 weeks), smaller peaks during daily backups.

 Graph2: "Number of single block read of 1 ms or less (that is blocks read from the SSD cache of the storage)" plotted as a function of time. Reading from the cache can be seen to go to zero during backups full backups (every two weeks, see also graph 1).

First conclusions and future work: IO becomes slow because backups effectively seem to flush the SSD cache. Also Very long response times are seen from single block IO. There is work to do on the storage side!
What about actions on the DB? Moving backup to the (active) Data Guard, can be of help, as it would effectively remove the workload source of contention.


Techniques and references: To analyze AWR data I have built a set of custom queries against dba_hist_* views and used them inside the excellent Perfsheet by Tanel Poder.
Moreover I'd like to reference James Morle's blog
This is the text of the query used, among others, to generate the graph above:

--event histogram with wait_count rate and time
select cast(sn.begin_interval_time as date) beg_time,
    eh.dbid,
    sn.instance_number,
    eh.event_name,
    eh.wait_time_milli,
    eh.wait_count,
    eh.wait_count - lag(eh.wait_count) over (partition by eh.dbid,eh.instance_number,eh.event_id,eh.wait_time_milli order by sn.snap_id nulls first) Delta_wait_count,
    extract(hour from END_INTERVAL_TIME-begin_interval_time)*3600
              + extract(minute from END_INTERVAL_TIME-begin_interval_time)* 60
              + extract(second from END_INTERVAL_TIME-begin_interval_time) DeltaT_sec,
    round((eh.wait_count - lag(eh.wait_count) over (partition by eh.dbid,eh.instance_number,eh.event_id,eh.wait_time_milli order by sn.snap_id nulls first)) /
          (extract(hour from END_INTERVAL_TIME-begin_interval_time)*3600
              + extract(minute from END_INTERVAL_TIME-begin_interval_time)* 60
              + extract(second from END_INTERVAL_TIME-begin_interval_time)),2 ) Rate_wait_count_per_bin
from dba_hist_event_histogram eh,
     dba_hist_snapshot sn
where
%FILTER%
and sn.snap_id = eh.snap_id
and sn.dbid = eh.dbid
and sn.instance_number = eh.instance_number
and sn.begin_interval_time between %FROM_DATE% and %TO_DATE%

Thursday, April 26, 2012

Of I/O Latency, Skew and Histograms 1/2


This is a performance investigation of Oracle DB and interaction with storage. 

Case: DB operations are slow during backup. The system is an OLTP-like workload, IO bound. Most of the reads are via indexes, typically single-block access, not much full scan.The system has still many free CPU cycles.  
First analysis: single block read times jump to very high values when backups start.
Tools: Use AWR data, to plot db file sequential read wait time over an interval of about 3 weeks. Large spikes can be seen during full DB backup. Spikes are also seen daily when incremental backup starts (see graph below)


Graph: average time spent on db file sequential read events aggregated per hour and plotted as as function of time. High and large spikes of IO latency can be seen during full backups. Smaller spikes during daily incremental backups.

Conclusions from first analysis: Users most important queries are IO latency-bound, latency jumps up during backups, therefore this explains the slowdown seen by the users.

Drill down: We want to understand why IO is slow during backup. Is it some sort of 'interference' of the sequential IO of the backup with random IO of the users? Is it an Oracle problem or a storage problem?
Main idea: use event histogram values reported by Oracle instrumentation to study skew on IO access time and find more about the root cause of the issue. Investigations: see part 2 of this blog entry.

Techniques and references: To analyze AWR data I have built a set of custom queries against dba_hist_* views and used them inside the excellent Perfsheet by Tanel Poder.
This is the text of the query used, among others, to generate the graph above:


-- system_event with rate and time
select cast(sn.begin_interval_time as date) beg_time,
    ss.dbid,
    sn.instance_number,
    ss.event_name,
    ss.wait_class,
    ss.total_waits,
    ss.time_waited_micro,
    ss.total_waits - lag(ss.total_waits) over (partition by ss.dbid,ss.instance_number,ss.event_id order by sn.snap_id nulls first) Delta_waits,
    ss.time_waited_micro - lag(ss.time_waited_micro) over (partition by ss.dbid,ss.instance_number,ss.event_id order by sn.snap_id nulls first) Delta_timewaited,
    extract(hour from END_INTERVAL_TIME-begin_interval_time)*3600
              + extract(minute from END_INTERVAL_TIME-begin_interval_time)* 60
              + extract(second from END_INTERVAL_TIME-begin_interval_time) DeltaT_sec,
    round((ss.total_waits - lag(ss.total_waits) over (partition by ss.dbid,ss.instance_number,ss.event_id order by sn.snap_id nulls first)) /
          (extract(hour from END_INTERVAL_TIME-begin_interval_time)*3600
              + extract(minute from END_INTERVAL_TIME-begin_interval_time)* 60
              + extract(second from END_INTERVAL_TIME-begin_interval_time)),2 ) Waits_per_sec,
    round((ss.time_waited_micro - lag(ss.time_waited_micro) over (partition by ss.dbid,ss.instance_number,ss.event_id order by sn.snap_id nulls first)) /
          (extract(hour from END_INTERVAL_TIME-begin_interval_time)*3600
              + extract(minute from END_INTERVAL_TIME-begin_interval_time)* 60
              + extract(second from END_INTERVAL_TIME-begin_interval_time)),2 ) Rate_timewaited,  -- time_waited_microsec/clock_time_sec
    round((ss.time_waited_micro - lag(ss.time_waited_micro) over (partition by ss.dbid,ss.instance_number,ss.event_id order by sn.snap_id nulls first)) /
           nullif(ss.total_waits - lag(ss.total_waits) over (partition by ss.dbid,ss.instance_number,ss.event_id order by sn.snap_id nulls first),0),2) Avg_wait_time_micro
from dba_hist_system_event ss,
     dba_hist_snapshot sn
where
%FILTER%
and sn.snap_id = ss.snap_id
and sn.dbid = ss.dbid
and sn.instance_number = ss.instance_number
and sn.begin_interval_time between %FROM_DATE% and %TO_DATE%

Wednesday, April 18, 2012

Uno

This is the first entry of this blog. Just to see if all works and to tune the layout. The blog will cover Oracle and databases. In particular tuning and internals.