Showing posts with label Spark. Show all posts

Monday, March 17, 2025

ATLAS DCS Analysis with Apache Spark and Jupyter Notebooks

The ATLAS Detector Control System (DCS) at CERN is essential for ensuring optimal detector performance. Each year, the system generates tens of billions of time-stamped sensor readings, presenting considerable challenges for large-scale data analysis. Although these data are stored in Oracle databases that excel in real-time transactional processing, the configuration—optimized with limited CPU resources to manage licensing costs—makes them less suited for extensive historical time-series analysis.

To overcome these challenges, a modern data pipeline has been developed that leverages Apache Spark, CERN’s Hadoop service, and the Service for Web-based Analysis (SWAN) platform. This scalable, high-performance framework enables researchers to efficiently process and analyze DCS data over extended periods, unlocking valuable insights into detector operations. By integrating advanced big data technologies, the new system enhances performance monitoring, aids in troubleshooting Data Acquisition (DAQ) link failures, and supports predictive maintenance, thereby ensuring the continued reliability of the ATLAS detector systems.

Note: this blog post is a reduced version of the article Advancing ATLAS DCS Data Analysis with a Modern Data Platform by Luca Canali, Andrea Formica and Michelle Solis.


The Data Pipeline: From Storage to Analysis

Figure 1: Overview of the Big Data architecture for Detector Control System (DCS) data analysis. The system integrates data from Oracle databases (including DCS, luminosity, and run information) and file-based metadata and mappings into the Hadoop ecosystem using Parquet files. Apache Spark serves as the core processing engine, enabling scalable analysis within an interactive environment powered by Jupyter notebooks on CERN SWAN. Reproduced with permission from Advancing ATLAS DCS Data Analysis with a Modern Data Platform.


Data Storage in Oracle Databases

The ATLAS Detector Control System (DCS) data is primarily stored in Oracle databases using a commercial product, the WinCC OA system, optimized for real-time monitoring and transactional operations. Each detector’s data is managed within dedicated database schemas, ensuring structured organization and efficient access.

At the core of this storage model is the EVENTHISTORY table, a high-volume repository that records sensor IDs, timestamps, and measurement values across thousands of monitoring channels. This table grows rapidly, exceeding one billion rows annually, requiring advanced partitioning strategies to facilitate efficient data access. To improve performance, range partitioning is implemented, segmenting the table into smaller, manageable partitions based on predefined time intervals, such as monthly partitions.

Since direct querying of this vast dataset for large-scale analysis can impose a heavy load on the production Oracle systems, a read-only replica copy, is used as the data source for many data querying use cases and for data extraction into CERN’s Hadoop-based analytics platform. This approach ensures that the primary database remains unaffected by analytical workloads, allowing detector experts to access and process historical data efficiently without impacting real-time operations.


Leveraging CERN’s Hadoop Service

To address the challenges of handling large-scale DCS data analysis, CERN’s Hadoop cluster, Analytix, provides a scalable and high-performance infrastructure tailored for parallelized computation and distributed storage. With over 1,400 physical cores and 20 PB of distributed storage, it enables efficient ingestion, processing, and querying of massive datasets.

Currently, approximately 3 TB of DCS data—representing 30% of the total available records—has been migrated into the Hadoop ecosystem, covering data from 2022 onward. Data extraction is performed via Apache Spark, leveraging the Spark JDBC connector to read from the read-only Oracle replica. Daily import jobs incrementally update the core EVENTHISTORY table, appending new records without reprocessing the entire dataset. Smaller, less dynamic tables undergo full replacements to maintain consistency.

For optimized storage and performance, all ingested data is converted to Apache Parquet format, a columnar storage system designed for high-speed analytical queries. The dataset is partitioned by day, enabling partition pruning—a technique that allows queries to efficiently filter relevant time slices, significantly reducing query execution times. The system can use Spark's parallel processing to rapidly process queries that target billions of individual data rows, completing such operations in just a few seconds and making it an ideal solution for correlation studies, anomaly detection, and long-term trend analysis of detector performance.

This modern data pipeline integrates seamlessly with CERN’s Jupyter notebooks service (SWAN), providing detector experts with a Python-based interactive environment for exploratory data analysis, visualization, and machine learning applications. The combination of Apache Spark, Parquet, and Hadoop enables the scalable processing of DCS data, facilitating key analyses such as monitoring DAQ link instabilities, tracking high-voltage performance, and diagnosing hardware failures in the ATLAS New Small Wheel (NSW) detector.


The Role of Apache Spark

Apache Spark plays a pivotal role in transforming how this data is accessed and analyzed. The Spark-based data pipeline extracts data from a read-only replica of the primary production database, ensuring minimal disruption to live operations. Using JDBC connectivity, Spark jobs are scheduled to run daily, incrementally updating Parquet files stored in CERN’s Hadoop cluster.

Key optimizations include:

  • Partitioning: Data is partitioned by day to facilitate faster querying and improved storage efficiency.

  • Incremental Updates: Only new data is ingested daily, preventing redundant processing.

  • Columnar Storage with Parquet: Apache Parquet enables efficient data retrieval, reducing query execution time and storage costs.


Extracting Data from Oracle using Apache Spark

Apache Spark plays a pivotal role in transforming how this data is accessed and analyzed. The Spark-based data pipeline extracts data from a read-only replica of the primary production database, ensuring minimal disruption to live operations. Using JDBC connectivity, Spark jobs are scheduled to run daily, incrementally updating Parquet files stored in CERN’s Hadoop cluster.

Below is an example of how to create a Spark DataFrame that reads from an Oracle table using JDBC:

Run Oracle free 23ai on a container from gvenzl dockerhub repo https://github.com/gvenzl/oci-oracle-free

  • docker run -d --name mydb1 -e ORACLE_PASSWORD=oracle -p 1521:1521 gvenzl/oracle-free:23-slim
  • wait till the DB is fully started by checking the progress of the startup log at: docker logs -f mydb1
You need an Oracle client JDBC jar, available in Maven Central or download from the Oracle website:
bin/pyspark --packages com.oracle.database.jdbc:ojdbc11:23.7.0.25.01


Edit with the target database username:

db_user = "system"

Database server connection string (modify for the actual setup):

db_connect_string = "localhost:1521/FREEPDB1"

Database password:

db_pass = "oracle"

Query to extract data from the target database (example query):

myquery = "SELECT rownum AS id FROM dual CONNECT BY level<=10"

Mapping the Oracle query/table to a Spark DataFrame:

df = (spark.read.format("jdbc")
           .option("url", f"jdbc:oracle:thin:@{db_connect_string}")
           .option("driver", "oracle.jdbc.driver.OracleDriver")
           .option("query", myquery)
           .option("user", db_user)
           .option("password", db_pass)
           .option("fetchsize", 10000)
           .load())

Show schema and data for testing purposes:

df.printSchema()
df.show()


For more details on using Spark to read data from Oracle databases, see this note.


Implementing Time Partitioning

To efficiently partition the data by time, a custom post-processing code in PySpark is used. Below is an example of how partitioning is applied:

Import necessary functions:

from pyspark.sql.functions import col, year, month, dayofmonth

Read data from Oracle as a DataFrame:

df = (spark.read.format("jdbc")
           .option("url", f"jdbc:oracle:thin:@{db_connect_string}")
           .option("driver", "oracle.jdbc.driver.OracleDriver")
           .option("dbtable", "EVENTHISTORY")
           .option("user", db_user)
           .option("password", db_pass)
           .option("fetchsize", 10000)
           .load())

# Extract partitioning keys (year, month, day) from the 'timestamp' column

df = df.withColumn("year", year(col("timestamp"))) \
       .withColumn("month", month(col("timestamp"))) \
       .withColumn("day", dayofmonth(col("timestamp")))

# Write the DataFrame as Parquet files partitioned by year, month, and day

output_path = "hdfs://path/to/output_directory"

df.write.partitionBy("year", "month", "day").parquet(output_path)


For more details on writing data to Parquet with Spark, see this note.


Analysis Framework: A User-Friendly Approach

Apache Spark as the Core Processing Engine

The Apache Spark ecosystem allows for seamless querying and processing of vast datasets. Spark DataFrames and Spark SQL APIs offer a familiar and flexible interface for data manipulation, similar to Pandas for Python users. By enabling distributed computation, Spark ensures that billions of rows can be processed within seconds.

Benefits of Spark in the ATLAS DCS framework:

  • Scalability and Performance: Spark efficiently uses the available cores on each node and distributes workloads across multiple nodes.

  • Powerful APIs: Spark natively uses the DataFrame API and also makes available the SQL language, both provide for powerful and expressive APIs to boost performance. 

  • Fault Tolerance: Spark has a proven architecture that provides automatic recovery and retries from many type of failures in a distributed environment.


Platform integration with Jupyter notebooks and Spark

Front-end analysis is conducted via Jupyter notebooks on the CERN’s SWAN platform, offering researchers an interactive and intuitive interface. Key capabilities include:

  • Spark integration: A dedicated component, the Spark Connector, abstracts the complexities of Spark configuration, ensuring seamless interaction with the Hadoop ecosystem.

  • Python environment and Dynamic Visualization: The platform harnesses the robust Python ecosystem for data processing, enabling the dynamic creation of tables, charts, and plots.

  • Data Integration: Seamless connectivity to diverse data sources—including Oracle databases and web services—simplifies the integration process, providing comprehensive access to all relevant data.


Figure 2: Analysis of ATLAS Detector Control System (DCS) data using Python and Apache Spark. The figure highlights specific elements of the ATLAS New Small Wheel (NSW) MicroMegas (MMG) subdetector that exhibited unstable behavior, prompting further investigation. This visualization was generated using a modern data platform that integrates Jupyter notebooks, CERN’s Hadoop service, and Spark-based analytics. The approach enables large-scale processing and efficient troubleshooting of detector performance. Reproduced with permission from Advancing ATLAS DCS Data Analysis with a Modern Data Platform.


Future Enhancements

To further optimize scalability, performance, and analytical capabilities, we are exploring several key improvements:

  • Kubernetes for Spark Orchestration: Moving from a Hadoop-based cluster to Kubernetes-managed Spark deployments will streamline resource allocation, optimize workload scheduling, and enable dynamic scaling during peak analysis periods. This transition also facilitates a smoother shift toward cloud-based architectures.

  • Cloud Storage Solutions: We are evaluating cloud-based storage options such as Amazon S3, which would further ease migration to a cloud environment and enhance data accessibility and scalability.

  • Advanced Data Formats: We are considering the adoption of modern data formats like Apache Iceberg and Delta Lake. These formats offer improved data ingestion workflows, better query performance and support for evolving data schemas, and enhanced data management capabilities in general.

  • Machine Learning and AI Integration: Leveraging GPU resources available on CERN’s SWAN platform will enable advanced machine learning techniques for predictive analytics, anomaly detection, and automated troubleshooting. This integration aims to identify detector inefficiencies and potential failures in real time, ultimately improving operational reliability and reducing downtime.

These enhancements aim to future-proof the DCS data analysis framework, ensuring it remains a highly efficient, scalable, and adaptable platform for ongoing and future ATLAS detector operations.


Conclusion

The integration of Apache Spark with CERN’s Hadoop infrastructure and CERN's Notebook service, has significantly enhanced ATLAS DCS data processing and analysis, by enabling a scalable, high-performance, and user-friendly platform. This framework empowers researchers to extract meaningful insights, enhance detector performance monitoring, and streamline troubleshooting processes, significantly improving operational efficiency. As the project continues to evolve, the adoption of cloud-based storage, Kubernetes orchestration, and AI-driven analytics will further enhance the platform’s capabilities supporting the needs of the scientific and engineering community.


Acknowledgements and Links

This work is based on the article Advancing ATLAS DCS Data Analysis with a Modern Data Platform by Luca Canali, Andrea Formica and Michelle Solis. Many thanks to our ATLAS colleagues, in particular from the ADAM (Atlas Data and Metadata) team and ATLAS DCS. Special thanks to the CERN Databases and Data Analytics group for their help and support with Oracle, Hadoop, SWAN and Spark services.

Additional links and notes:


Friday, August 28, 2020

Apache Spark 3.0 Memory Monitoring Improvements

TLDR; Apache Spark 3.0 comes with many improvements, including new features for memory monitoring. This can help you troubleshooting memory usage and optimizing the memory configuration of your Spark jobs for better performance and stability, see SPARK-23429 and SPARK-27189.

The problem with memory
Memory is key for the performance and stability of Spark jobs. If you don't allocate enough memory for your Spark executors you are more likely to run into the much dreaded Java OOM (out of memory) errors or substantially degrade your jobs' performance. Memory is needed by Spark to execute efficiently Dataframe/RDD operations, and for improving the performance of algorithms that would otherwise have to swap to disk in their processing (e.g. shuffle operations), moreover, it can be used for caching data, reducing I/O. This is all good in theory, but in practice how do you know how much memory you need?

A basic solution
One first basic approach to memory sizing for Spark jobs, is to start by giving the executors ample amounts of memory, provided your systems has enough resources. For example, by setting the spark.executor.memory configuration parameter to several GBs. Note, in local mode you would set sprk.driver.memory instead. You can further tune the configuration by trial-and-error, by reducing and increasing memory with each test and observe the results. This approach may give good results quickly, but it is not a very solid approach to the problem.

A more structured approach to memory usage troubleshooting and to sizing memory for Spark jobs is to use monitoring data to understand how much memory is used by the Spark application, which jobs request more memory, and which memory areas are used, finally linking this back to the application details and in the context of other resources utilization (for example, CPU usage).
This approach helps with drilling down on issues of OOM, and also to be more precise in allocating memory for Spark applications, aiming at using just enough memory as needed, without wasting memory that can be a scarce shared resource in some systems. It is still an experimental and iterative process, but more informed than the basic trial-and-error solution.

How memory is allocated and used by Spark

Configuration of executor memory

The main configuration parameter used to request the allocation of executor memory is spark.executor.memory.Spark running on YARN, Kubernetes or Mesos, adds to that a memory overhead  to cover for additional memory usage (OS, redundancy, filesystem cache, off-heap allocations, etc), which is calculated as memory_overhead_factor * spark.executor.memory  (with a minimum of 384 MB). The overhead factor is 0.1 (10%), it can be configured when running on Kubernetes (only) using spark.kubernetes.memoryOverheadFactor.
When using PySpark additional memory can be allocated using spark.executor.pyspark.memory
Additional memory for off-heap allocation is configured using spark.memory.offHeap.size=<size> and spark.memory.offHeap.enabled=true. This works on YARN, for K8S, see SPARK-32661.  
Note also parameters for driver memory allocation: spark.driver.memory and spark.driver.memoryOverhead
Note: this covers recent versions of Spark at the time of this writing, notably Spark 3.0 and 2.4. See also Spark documentation.
  
Figure 1: Pictorial representation of the memory areas allocated and used by Spark executors and the main parameters for their configuration. 
  

Spark unified memory pool

Spark tasks allocate memory for execution and storage from the JVM heap of the executors using a unified memory pool managed by the Spark memory management systemUnified memory occupies by default 60% of the JVM heap: 0.6 * (spark.executor.memory - 300 MB). The factor 0.6 (60%) is the default value of the configuration parameter spark.memory.fraction. 300MB is a hard-coded value of "reserved memory". The rest of the memory is used for user data structures, internal metadata in Spark, and safeguarding against OOM errors. 
Spark manages execution and storage memory requests using the unified memory pool. When little execution memory is used, storage can acquire most of the available memory, and vice versa. Additional structure in the working of the storage and execution memory is exposed with the configuration parameter spark.memory.storageFraction (default is 0.5), which guarantees that the stored blocks will not be evicted from the unified memory by execution below the specified threshold.
The unified memory pool can optionally be allocated using off-heap memory, the relevant configuration parameters are: spark.memory.offHeap.size and spark.memory.offHeap.enabled
  

Opportunities for memory configuration settings

The first key configuration to get right is spark.executor.memory. Monitoring data (see the following paragraphs) can help you understand if you need to increase the memory allocated to Spark executors and or if you are already allocating plenty of memory and can consider reducing the memory footprint.
There are other memory-related configuration parameters that may need some adjustments for specific workloads: this can be analyzed and tested using memory monitoring data.
In particular, increasing spark.memory.fraction (default is 0.6) may be useful when deploying large Java heap, as there is a chance that you will not need to set aside 40% of the JVM heap for user memory. With similar reasoning, when using large Java heap allocation, manually setting spark.executor.memoryOverhead to a value lower than the default (0.1 * spark.executor.memory) can be tested.
  

Memory monitoring improvements in Spark 3.0

Two notable improvements in Spark 3.0 for memory monitoring are:
  • SPARK-23429: Add executor memory metrics to heartbeat and expose in executors REST API
    • see also the umbrella ticket SPARK-23206: Additional Memory Tuning Metrics
  • SPARK-27189: Add Executor metrics and memory usage instrumentation to the metrics system
When troubleshooting memory usage it is important to investigate how much memory was used as the workload progresses and measure peak values of memory usage. Peak values are particularly important, as this is where you get possible slow downs or even OOM errors. Spark 3.0 instrumentation adds monitoring data on the amount of memory used, drilling down on unified memory, and memory used by Python (when using PySpark). This is implemented using a new set of metrics called "executor metrics", and can be helpful for memory sizing and troubleshooting performance. 
    

Measuring memory usage and peak values using the REST API

An example of the data you can get from the REST API in Spark 3.0:

WebUI URL + /api/v1/applications/<application_id>/executors

Here below you can find a snippet of the peak executor memory metrics, sampled on a snapshot and limited to one of the executors used for testing:
"peakMemoryMetrics" : {
    "JVMHeapMemory" : 29487812552,
    "JVMOffHeapMemory" : 149957200,
    "OnHeapExecutionMemory" : 12458956272,
    "OffHeapExecutionMemory" : 0,
    "OnHeapStorageMemory" : 83578970,
    "OffHeapStorageMemory" : 0,
    "OnHeapUnifiedMemory" : 12540212490,
    "OffHeapUnifiedMemory" : 0,
    "DirectPoolMemory" : 66809076,
    "MappedPoolMemory" : 0,
    "ProcessTreeJVMVMemory" : 38084534272,
    "ProcessTreeJVMRSSMemory" : 36998328320,
    "ProcessTreePythonVMemory" : 0,
    "ProcessTreePythonRSSMemory" : 0,
    "ProcessTreeOtherVMemory" : 0,
    "ProcessTreeOtherRSSMemory" : 0,
    "MinorGCCount" : 561,
    "MinorGCTime" : 49918,
    "MajorGCCount" : 0,
    "MajorGCTime" : 0
  },

Notes:
  • Procfs metrics (SPARK-24958) provide a view on the process usage from "the OS point of observation".
    • Notably, procfs metrics provide a way to measure memory usage by Python, when using PySpark and in general other processes that may be spawned by Spark tasks.
  • Profs metrics are gathered conditionally:
    • if the /proc filesystem exists
    • if spark.executor.processTreeMetrics.enabled=true
    • The optional configuration spark.executor.metrics.pollingInterval allows to gather executor metrics at high frequency, see doc.
  • Additional improvements of the memory instrumentation via REST API (targeting Spark 3.1) are in "SPARK-23431 Expose the new executor memory metrics at the stage level".
  

Improvements to the Spark metrics system and Spark performance dashboard

The Spark metrics system based on the Dropwizard metrics library provides the data source to build a Spark performance dashboard. A dashboard naturally leads to time series visualization of Spark performance and workload metrics. Spark 3.0 instrumentation (SPARK-27189) hooks to the executor metrics data source and makes available the time series data with the evolution of memory usage. 
Some of the advantages of collecting metrics values and visualizing them with Grafana are:
  • The possibility to see the evolution of the metrics values in real time and to compare them with other key metrics of the workload. 
  • Metrics can be examined as aggregated values or drilled down at the executor level. This allows you to understand if there are outliers or stragglers.
  • It is possible to study the evolution of the metrics values with time and understand which part of the workload has generated certain spikes in a given metric, for example. It is also possible to annotate the dashboard graphs, as explained at this link, with details of query id, job id, and stage id.
Here are a few examples of dashboard graphs related to memory usage:


Figure 2: Graphs of memory-related  metrics collected and visualized using a Spark performance dashboard. Metrics reported in the figure are: Java heap memory, RSS memory, Execution memory, and Storage memory. The Grafana dashboard allows us to drill down on the metrics values per executor. These types of plots can be used to study the time evolution of key metrics.
  

What if you are using Spark 2.x?

Some monitoring features related to memory usage are already available in Spark 2.x and still useful in Spark 3.0:
  • Task metrics are available in the REST API and in the dropwizard-based metrics and provide information:
    • Garbage Collection time: when garbage collection takes a significant amount of time typically you want to investigate for the need for allocating more memory (or reducing memory usage).
    • Shuffle-related metrics: memory can prevent some shuffle operations with I/O to storage and be beneficial for performance.
    • Task peak execution memory metric.
  • The WebUI reports storage memory usage per executor.
  • Spark dropwizard-based metrics system provides a JVM source with memory-related utilization metrics.


Lab configuration:

When experimenting and trying to get a grasp for the many parameters related to memory and monitoring, I found it useful to set up a small test workload. Some notes on the setup I used:


bin/spark-shell --master yarn --num-executors 16 --executor-cores 8 \
--driver-memory 4g --executor-memory 32g \
--jars /home/luca/spark-sql-perf/target/scala-2.12/spark-sql-perf_2.12-0.5.1-SNAPSHOT.jar \
--conf spark.eventLog.enabled=false \
--conf spark.sql.shuffle.partitions=512 \
--conf spark.sql.autoBroadcastJoinThreshold=100000000 \
--conf spark.executor.processTreeMetrics.enabled=true
  
  
import com.databricks.spark.sql.perf.tpcds.TPCDSTables
val tables = new TPCDSTables(spark.sqlContext, "/home/luca/tpcds-kit/tools","1500")
tables.createTemporaryTables("/project/spark/TPCDS/tpcds_1500_parquet_1.10.1", "parquet")
val tpcds = new com.databricks.spark.sql.perf.tpcds.TPCDS(spark.sqlContext)
val experiment = tpcds.runExperiment(tpcds.tpcds2_4Queries)


Limitations and caveats

  • Spark metrics and instrumentation are still an area in active development. There is room for improvement both in their implementation and documentation. I found that some of the metrics may be difficult to understand or may present what looks like strange behaviors in some circumstances. In general, more testing and sharing experience between Spark users may be highly beneficial for further improving Spark instrumentation.
  • The tools and methods discussed here are based on metrics, they are reactive by nature, and suitable for troubleshooting and iterative experimentation.
  • This post is centered on  describing Spark 3.0 new features for memory monitoring and how you can experiment with them. A key piece left for future work is to show some real-world examples of troubleshooting using memory metrics and instrumentation.
  • For the scope of this post, we assume that the workload to troubleshoot is a black box and that we just want to try to optimize the memory allocation  and use. This post does not cover techniques to improve the memory footprint of Spark jobs, however, they are very important for correctly using Spark. Examples of techniques that are useful in this area are: implementing the correct partitioning scheme for the data and operations, reducing partition skew, using the appropriate join mechanisms, streamlining caching, and many others, covered elsewhere. 
  

References

Talks:
Spark documentation and blogs:

JIRAs:  SPARK-23206SPARK-23429 and SPARK-27189 contain most of the details of the improvements in Apache Spark discussed here.


Conclusions and acknowledgments

It is important to correctly size memory configurations for Spark applications. This improves performance, stability, and resource utilization in multi-tenant environments. Spark 3.0 has important improvements to memory monitoring instrumentation. The analysis of peak memory usage, and of memory use broken down by area and plotted as a function of time, provide important insights for troubleshooting OOM errors and for Spark job memory sizing.   
Many thanks to the Apache Spark community, and in particular the committers and reviewers who have helped with the improvements in SPARK-27189.
This work has been developed in the context of the data analytics services at CERN, many thanks to my colleagues for help and suggestions.  
  

Thursday, April 25, 2019

Machine Learning Pipelines for High Energy Physics Using Apache Spark with BigDL and Analytics Zoo

Topic: This post describes a data pipeline for a machine learning task of interest in high energy physics: building a particle classifier to improve event selection at the particle detectors. The pipeline is built using tools from the "Big Data ecosystem", notably Apache Spark, BigDL and Analytics Zoo. The work is accompanied by a set of notebooks with code and sample data.

The Physics use case

High Energy Physics (HEP) is a data-intensive domain: particle detectors and their sensors collect vast amounts of data. Data pipelines that move data from detectors to analysis engines are key to the experiments' success and operate at high throughput. For example, the amount of data flowing through the online systems at LHC experiments is currently of the order of 1 PB/s, with particle collision events happening every 25 ns. Most of the data thus collected has to be thrown away as it would be too costly to store the raw data. This is performed by fast data processing by a trigger system organized in multiple levels. The rate of data stored for later analysis is currently around 1-10 GB/sec.
Every improvement in the accuracy of the event filtering system is welcome as it can provide large savings in terms of compute and storage resources needed for data analysis. The work "Topology classification  with  deep  learning  to  improve  real-time event  selection  at  the  LHC" by Nguyen et al. provides a promising solution to this problem by using neural networks. The paper details how to build a classifier to used to improve the purity of data samples selected at trigger level, by distinguishing three different event topologies of interest ("W + jet", "QCD", "t tbar"). The classifier is intended to be used in the online filtering system to improve accuracy and in particular reduce the number of false positives compared to current systems, often implemented as complex rule-based systems.
The primary goal of this work is to reproduce the classification performance results of Nguyen et al., showing that the proposed pipeline makes a more efficient usage of computing resources and/or provides a more productive interface for the data scientist/physicists, along all the steps of the processing pipeline.


Figure 1: Event data collected from the particle detector (CMS experiment) contains different types of event topologies of interest. A particle classifier built with neural networks can be used as an event filter, improving state of the art in accuracy.

Data pipelines

Data pipelines are of paramount importance to make machine learning projects successful, by integrating multiple components and APIs used across the entire data processing chain. A good data pipeline implementation can accelerate and improve the productivity of the work around the core machine learning tasks. In particular, data pipelines are expected to provide solid tools for data processing, a task that ends up being one of the most time-consuming for data scientists/physicists approaching data analysis problems.
Traditionally, HEP has developed custom tools for data processing, which have been successfully used for decades. Recently, a large range of solutions for data processing and machine learning have become available from open source communities. The maturity and adoption of such solutions continue to grow both in industry and academia. Using software from open source communities comes with several advantages, including the reduced cost of development and maintenance and the possibility of sharing solutions and expertise with a large user and expert base.

In this work we build the machine learning pipeline detailed in the paper on topology classification with DL mentioned above, using tools from the "Big Data" ecosystem.
One of the key objectives for the machine learning data pipeline is to transform raw data into more valuable information used to train the ML/DL models. Apache Spark provides the backbone of the pipeline, from the task of fetching data from the storage system to feature processing and feeding training data into a DL engine (BigDL and Analytics Zoo are used in this work). The four steps of the pipeline we built are:

  • Data Ingestion: where we read data from ROOT format and from the CERN-EOS storage system, into a Spark DataFrame and save the results as a table stored in Apache Parquet files
  • Feature Engineering and Event Selection: where the Parquet files containing all the events details processed in Data Ingestion are filtered, and datasets with new  features are produced
  • Parameter Tuning: where the best set of hyperparameters for each model architecture are found by performing grid search
  • Training: where the best models found in the previous step are trained on the entire dataset

Figure 2: This illustrates the data processing pipeline used for training the event topology classifier.

Data source 

Data used for this work have been generated using software simulators to generate events and to calculate the detector response. The dataset is the result of a Monte Carlo event generation, where three different processes (categories) have been simulated: the inclusive production of a leptonically decaying W+/- boson, the pair production of a top-antitop pair (t, t_bar) and hadronic production of multijet events. Variables of low and high level are included in the dataset. See the paper on topology classification with DL for details.
For this exercise, the generated training data amounts to 4.5 TB, for a total of 54 million events, divided in 3 classes: "W + jet", "QCD", "t tbar" events. The generated training data is stored using the ROOT format, as it is a very common format for HEP. Data are originally stored in the CERN EOS storage system as it is the case for the majority of HEP data at CERN at present. The authors of the paper have kindly shared the training data for the purpose of this work. Each event of the dataset consists of a list of reconstructed particles. Each particle is associated with features providing information on the particle cinematic (position and momentum) and on the type of particle. Follow this link for additional details on the datasets and links to download data samples made available to reproduce this work.

Data ingestion

Data ingestion is the first step of the pipeline, where we read ROOT files from the CERN EOS storage system into a Spark DataFrame. For this, we use a dedicated library able to ingest ROOT data into Spark DataFrames: spark-root, an Apache Spark data source for the ROOT file format. It is based on a Java implementation of the ROOT I/O libraries, which offers the ability to translate ROOT files into Spark DataFrames and RDDs. In order to access the files stored in the CERN EOS storage system from Spark applications, another library has been developed: the Hadoop-XRootD connector. The Hadoop-XRootD connector is a Java library, it extends the HADOOP Filesystem and makes its capable of accessing files in EOS via the XRootD protocol. This allows Spark to read directly from EOS. which is convenient for our use case as it avoids the need for copying data in HDFS or other storage compatible with Spark/Hadoop libraries.
At the end of the data ingestion step the result is that data, with the same structure as the original ROOT files, are made available as a Spark DataFrame on which we can perform event selection and feature engineering.

Event selection and feature engineering

In this step of the pipeline, we process the dataset by applying relevant filters, by computing derived features and by applying data normalization techniques.
The first part of the processing requires domain-specific knowledge in HEP to simulate trigger selection: this is emulated by requiring all the events to include one isolated electron or muon with transverse momentum (p_T) above a given threshold, p_T >= 23 GeV. All particle are then ranked in decreasing order of p_T. For each event, the isolated lepton is the first entry of the list of particles. Together with the isolated lepton, the first 450 charged particles, the first 150 photons, and the first 200 neutral hadrons have been considered, for a total of 801 particles with 19 features each. The result is, that each event passing the filter is associated to a matrix with shape 801 x 19. This defines the Low Level Features (LLF) dataset.
Starting from the LLF, an additional set of 14 High Level Features (HLF) is computed. These additional features are motivated by known physics and data processing steps and will be of great help for improving the neural network model in later steps.
LLF and HLF datasets, computed as described above, are saved in Apache Parquet format: the amount of training data is reduced at this point from the original 4.4 TB of ROOT files to 950 GB of snappy-compressed Parquet files.

Additional processing steps are performed and include operations frequently found when preparing training data for classifiers, notably:
  • Data undersampling. This is done to work around the class imbalance in the original training data. After this step, we have the same number of events per each of the three classes, that is 1.4 million events for each of the 3 classes.
  • Data shuffling
  • All the features present in the datasets are scaled to take values between 0 and 1 or normalized, as needed for the different classifiers.
  • The datasets (for HLF and LLF features) are split in training and test datasets (80% and 20% respectively) and saved in two sets of Parquet files. Smaller datasets are also created as samples of the full train and test datasets, for development purposes,
Data are saved in snappy-compressed Parquet format at the end of this stage and amount to about 310 GB. The decrease in size from the previous step is mostly due to the undersampling step and the fact that the population on the 3 topology classes in the original training data used for this work are not balanced.


Code for this step: notebook for data ingestion and for feature preparation

Neural network models

We have tested three different neural network models, following the guiding research paper:

1. The first and simplest model is the "HLF Classifier". It is a fully connected feed-forward deep neural network taking as input the 14 high level features. The chosen architecture consists of three hidden layers with 50, 20, 10 nodes activated by Rectified Linear Units (ReLU). The output layer consists of 3 nodes, activated by the Softmax activation function.

2. The "Particle Sequence Classifier" is trained using recursive layers, taking as input the 801 particles in the Low Level Features dataset. Prior to "feeding the particles" into a recurrent neural network, particles are ordered by decreasing distance from the isolated lepton (see the original article for details).
Gated Recurrent Units (GRU) have been used to aggregate the input sequence of particles with a recurrent layer width of 50. The output of the GRU layer is fed into a fully connected layer with 3 Softmax-activated nodes.

3. The "Inclusive Classifier" is the most complex of the 3 models tested. In this classifier, some domain knowledge is injected into the particle-sequence classifier. In order to do this, the architecture of the particle sequence classifier has been modified by concatenating the 14 High Level Features to the output of the GRU layer after a dropout layer. An additional dense layer of 25 nodes is introduced before the final output layer consisting of 3 nodes, activated by the Softmax activation function.


Figure 3: (left) Code snippet of the inclusive classifier model with Analytics zoo, using Keras-API. (right) Neural network model diagram from Nguyen et al. 

Parameter tuning

Hyperparameter tuning is a common step for improving machine learning pipelines. In this work, we have used Spark to speed up this step. Spark allows training multiple models with different parameters concurrently on a cluster, with the result of speeding up the hyperparameter tuning step. We used the Area Under the ROC curve as the performance metric to compare different classifiers. When performing a grid search each run is independent of the others, hence this process can be easily parallelized and scales very well.
For example, we tested the High Level Features classifier, a feed forward neural network, taking as input the 14 High Level Features. For this model, we tested changing the number of layers and units per layer, the activation function, the optimizer, etc. As an experiment, we ran grid search on the small dataset containing 100K events using a grid of ~200 hyper-parameters sets (models).
Hyperparameter tuning can similarly be repeated for all three classifiers described above. For the following work, we have decided to use the same models as the ones presented in the paper, as they were offering the best trade-off between performances and complexity.
To run grid search in parallel, we used Spark with spark-sklearn and Tensorflow/Keras wrapper for scikit_learn.

Code: notebook with hyperparameter tuning

Figure 4: The hyperparameter tuning step consists of running multiple training jobs with the goal of finding an optimal set of parameters. Spark has been used to speed-up this step by running multiple Keras training jobs in parallel on a cluster.


Distributed training with Spark, BigDL and Analytics Zoo

There are many suitable software and platform solutions for deep learning training at present, and it is an exciting time in this respect with many paths to explore. However, choosing among them is not straightforward, as many products are available with different characteristics and optimizations for different areas of application.
For this work, we wanted to use a solution that easily integrates with the Spark service at CERN, running on YARN/Hadoop cluster (more recently also running Spark on Kubernetes using cloud resources). GPUs and other HW accelerators are not yet available for Spark deployments at CERN, so we also wanted a solution that could scale on CPUs. Moreover, we wanted to use Python/PySpark and standard APIs for processing the neural network: notably Keras API in this case.
Those reasons combined with our ongoing collaboration with Intel in the context of CERN openlab has led us to successfully test and use BigDL and Analytics Zoo for distributed model training in this work. BigDL and Analytics Zoo are open source projects distributed under the Apache 2.0 license. They provide a distributed deep learning framework for Big Data platforms and are implemented as libraries on top of Apache Spark. They allow users to write large-scale deep learning applications as standard Spark programs, running on existing Spark clusters. Notably, they allow users to work with models defined with Keras and Tensorflow APIs.
BigDL provides data-parallelism to train models in a distributed fashion across a cluster using synchronous mini-batch Stochastic Gradient Descent. Data are automatically partitioned across Spark executors as an RDD of Sample: an RDD of N-Dimensional array containing the input features and label. Distributed training is implemented as an iterative process, thus there will be multiple iterations over the same data. Reading data from disk multiple times is slow, for this reason, BigDL exploits the in-memory capabilities of Spark to cache the train RDD in the memory of each worker allowing faster access during the iterations (this also means that sufficient memory needs to be allocated for training large datasets). More information on BigDL architecture can be found in the BigDL white paper.
Notebooks with the code used for training the DL models are:


Figure 5: Snippets of code illustrating key operations for deploying distributed model training in Spark using BigDL and Analytics Zoo.

The resulting classifiers show very good performance figures for the three models tested, and reproduce the findings of the original research paper. The fact that the HLF classifier performs well, despite its simplicity, can be justified by the fact that we are putting a considerable physics knowledge into the the definition of the 14 high level features. This conclusion is further reinforced by additional tests, where we have built a topology classifier using a "random decision forest" and a "gradient boosting" (XGBoost) model, trained using the high level features dataset. In both cases we have obtained very good performance of the classifiers, just close to what has been achieved with the HLF classifier model.
In contrast, the fact that the particle sequence classifier performs better than the HLF classifier is remarkable, because we are not putting any a priori knowledge into the particle sequence classifier: the model is taking just a list of particles as input. Further improvements are seen by combining the HLF with the particle sequence classifier. In some sense, the GRU layer is identifying important features and physics quantities out of the training data, rather than using knowledge injected via feature engineering.

Figure 6: (Right) ROC curve and AUC for the three models tested. Good results are obtained that are consistent with the findings in the original research paper. (Left) Training and validation loss (categorical cross entropy) plotted as a function of iteration number for HLF classifier. Training convergence is obtained at around 50 epochs, depending on the model.


Figure 7: The confusion matrix for the "Inclusive classifier" model after training. Note that the off-diagonal elements are below 5% and the diagonal elements are close to 95%.
  

Workload and performance

Two Spark clusters have been used to develop and run the workload, the first is a development/test cluster, the second is a production consisting of 52 nodes, with the following resources:  1800 vcores, 14 TB of RAM, 9 PB of storage. It is a shared general-purpose YARN/Hadoop cluster build on commodity hardware, installed with Linux (CentOS 7). Only a fraction of the resources of the cluster was used when executing the pipeline, moreover jobs of other nature were running on the system currently.

Data ingestion and event filtering is a very resource-demanding step of the pipeline. Processing the original data set of 4.4 TB took ~3 hours, using 50 executors with 8 cores each, for a total of 400 cores allocated to the Spark job.
Monitoring of the workload showed that the job was almost completely CPU-bound. The large majority of the CPU cycles are spent executing Python code, that is outside of the Spark JVM. The fact that we chose to process the bulk of the training data using Python UDF functions mapped on RDDs is the main cause of the use of such large amount of CPU resources, as this a well-known "performance gotcha" in current versions of Spark. Notably, many CPU cycles are "wasted" in data serialization and deserialization operations, going back and forth from JVM and Python, in the current implementation.
Additional work on improving the performance of the event filtering has introduced the use of Spark SQL to implement some of the filters. Notably, we have made use of Spark SQL Higher Order Functions, a specialized category of SQL functions, introduced in Spark from version 2.4.0, that allow to improve processing for nested data (arrays). For our workload this has introduced the benefit of running a significant fraction of the filtering operations fully inside the JVM, optimized by the Spark code for DataFrame operations. The result is that the data ingestion step, optimized with Spark SQL and higher order functions, runs in ~2 hours (was 3 hours in the implementation that uses only Python UDF).
Future work on the pipeline may further address the issue of reducing the time spent in serialization and deserialization when using Python UDF, for example, we might decide to re-write the critical parts of the ingestion code in Scala. However, with the current training data size (4.4 TB), the performance of the data ingestion step, of just a couple of hours, is acceptable.

Performance of hyperparameter tuning with grid search: grid search runs multiple training jobs in parallel, therefore it is expected to scale well when run in parallel, as it was the case in our work (see also the paragraph on hyperparameter tuning). This is confirmed by measurements, as shown in Figure 8, by adding executors, i.e. the number of models trained in parallel, the time required to scan all the parameters decreases, as expected.

Figure 8: Performance of the hyperparameter tuning with grid search shows near-linear scalability as expected by this embarrassingly parallel process.

Performance of distributed training with BigDL and Analytics Zoo is also important for this exercise, as faster training time means improved productivity of the data scientist/physicists who will typically perform many experiments on the models and data. Figure 9 shows some preliminary results of the training speed for the HLF classifier, tested on the development cluster, using batch size of 32 per worker. You can notice there very good scalability behavior at the scale tested. Additional measurements, using 20 executors, with 6 cores each (for a total of 120 allocated cores), using batch size of 128 per worker, have shown training speed for the HLF classifier of the order of 100K rows/sec, sustained for the training of the full dataset. We have been able to train the model in less than 5 minutes, running for 12 epochs (each epoch processing 3.4 million training events). The batch size has an impact on the execution time and on the accuracy of the training. We found that a batch size of 128 for the HLF classifier is a good compromise for speed, which a batch size of 32 is slower but gives slightly better results, for example for producing publication plots. Future work will address more thorough investigation of the performance and scalability of the training step.

Figure 9: Performance of the training step for the HLF classifier on the development cluster. Very good scalability has been found at this scale.

An important point to keep in mind when training models with BigDL, is that the RDDs containing the features and labels datasets need to be cached in the executors' JVM memory. This can be a significant amount of memory. Figure 10 shows the RDDs cached by Spark block manager when training the model "Inclusive classifier" using BigDL.


Figure 10: Datasets cached using Spark block manager when training the "Inclusive Classifier" model using BigDL. More than 200 GB of RAM are used across the Spark cluster to cache the training and test data.

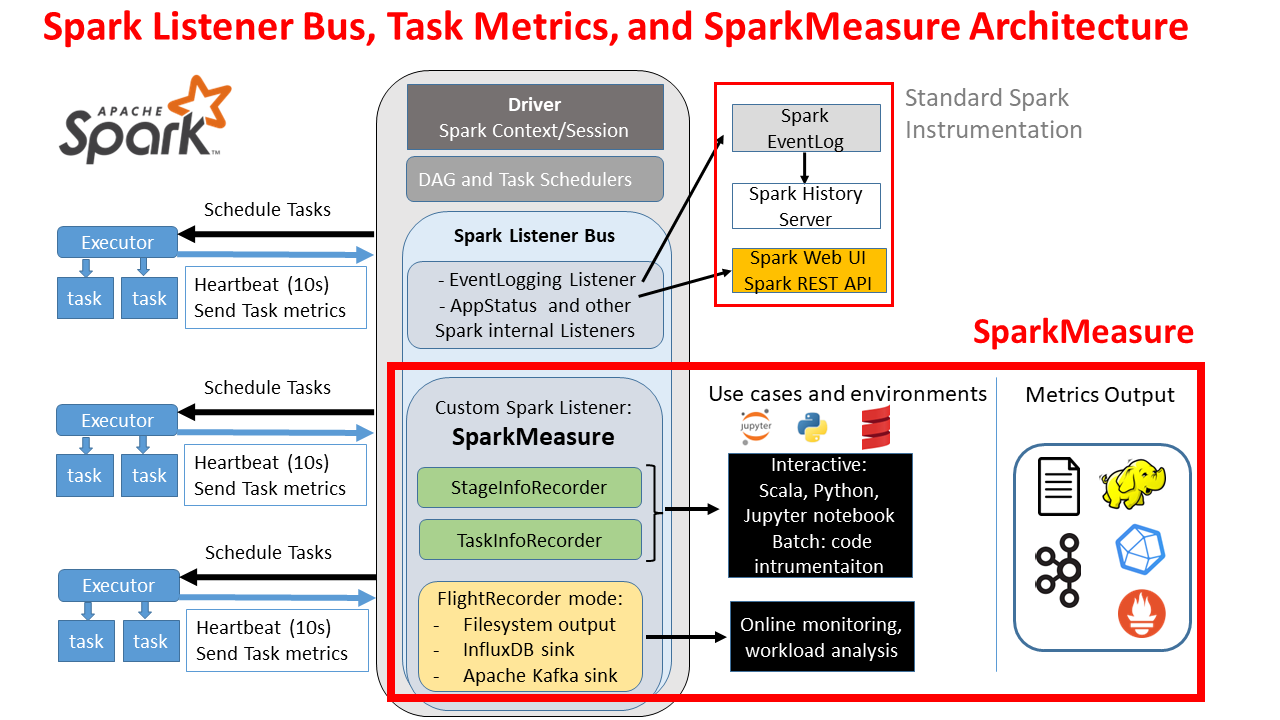
The training dataset size and the model complexity of the HLF classifier are of relatively small scale, making the HLF classifier suitable for training also on desktop computers. However, the Particle sequence classifier and the Inclusive classifier have a much higher complexity and require processing hundreds of GB of training data. Figure 11 shows the amount of CPU consumed during the training of the Particle Sequence classifier using BigDL/Analytics-zoo on a Spark cluster, using 70 executor and training with a batch size of 32. Notably, Figure 11 illustrates the fact that the training has lasted for 9 hours and has utilized the equivalent of 200 CPUs for the whole duration of the training. The executor CPU measurement has been performed using Spark monitoring instrumentation feeding into an InfluxDB backed and visualized with Grafana, as described in this post.


Figure 11: Measured aggregated CPU utilization of Spark executors during the training of the Particle Sequence classifier.

Conclusions, lessons learned and plans


We have successfully implemented the full data pipeline for training a "topology classifier" for event filtering at LHC experiments, using deep neural networks as detailed in an original research paper using tools and platforms from the Big Data and machine learning ecosystem in the High Energy Physics domain.
Apache Spark has been used as the main engine for the pipeline, we have appreciated the flexibility and the ease of use of Spark's API in the Python environment.
The integration of PySpark with Jupyter notebooks provides a user-friendly environment for data processing and exploration.
Additional key integrations with Spark have made this work possible, in particular, the spark-root library allows Spark to read data in ROOT format and the Hadoop-XRootD connector, which integrates Spark with CERN EOS storage system.
BigDL and Analytics Zoo have allowed us to easily scale out training using familiar Keras APIs and using the Spark clusters currently available at CERN.
We have identified areas for future performance improvements, notably in the data ingestion and filtering step where we chose to use Python functions on Spark RDDs for the current implementation.
Future work and plans include further exploration of the workload at scale, including running on cloud resources and investigating the use of HW accelerators for DL training. Another area we plan to explore in future work is to implement a streaming data pipeline with model inference, as the natural next step that follows this work.

Code for this work: https://github.com/cerndb/SparkDLTrigger
Presentation at Spark Summit 2019: Deep Learning on Apache Spark at CERN’s Large Hadron Collider with Intel Technologies
 

Acknowledgments

This work has been performed in the context of the Spark, Hadoop and Streaming services at CERN IT and has profited of the support and consultancy of the engineers in the service. The primary author of this work is Matteo Migliorini, who worked on it during his stay at CERN in 2018 under the supervision of Luca Canali. Additional credits go to Riccardo Castellotti, Viktor Khristenko and Maria Girone of CERN openlab, to Marco Zanetti of Padua University and to the authors of the research paper Topology classification  with  deep  learning  to  improve  real-time event  selection  at  the  LHC", in particular to Maurizio Pierini and Thong Nguyen. Credits to the BigDL and Analytics Zoo team at Intel, in particular, many thanks to Jiao (Jennie) Wang and Sajan Govindan.


Tuesday, February 19, 2019

A Performance Dashboard for Apache Spark

Topic: This post dives into the steps for deploying a performance dashboard for Apache Spark, using Spark metrics system instrumentation, InfluxDB and Grafana.

What problem does it solve: The dashboard can provide important insights for performance troubleshooting and online monitoring of Apache Spark workloads. In particular when running Spark applications in a distributed environment (Kubernetes, YARN, etc.).

Context: Familiarity with Spark architecture and the Web UI. This discussion also overlaps with other monitoring tooling discussed in this blog, notably sparkMeasure.
This work profits of recent updates to Spark metrics instrumentation, notably SPARK-22190,  SPARK-25228, SPARK-27189. It also builds on top of the ideas of previous work by Hammer Lab. Spark 3 plugins allow to extend the metrics and are useful to instrument Spark on K8S among others, see code and examples at cerndb/SparkPlugins.

Deploy the Spark dashboard using containers: The repository spark-dashboard supports the installation of the Spark Performance Dashboard using containers technology. Two different installation options are packaged in the repository, use the one that suits your environment best:
  • dockerfiles -> Docker build files for a Docker container image, use this to deploy the Spark Dashboard using Docker.
  • charts -> a Helm chart for deploying the Spark Dashboard on Kubernetes.

Updated in May 2021 - Spark dashboard demo


Step 1: Understanding the architecture

Spark metrics dashboard architecture


Spark is instrumented with the Dropwizard/Codahale metrics library. Several components of Spark are instrumented with metrics, see also the Spark monitoring guide, notably the driver and executors components are instrumented with multiple metrics each. In addition, Spark provides various sink solutions for the metrics. This work makes use of the Spark graphite sink and utilizes InfluxDB with a Graphite endpoint to collect the metrics. Finally Grafana is used for querying InfluxDB and plotting the graphs (see architectural diagram below).
An important architectural detail of the metrics system is that the metrics are sent directly from the sources to the sink. This is important when running in distributed mode. Each Spark executor, for example, will sink directly the metrics to InfluxDB. By contrast, WebUI/Eventlog instrumentation uses the Spark Listener Bus and metrics flow through the driver in that case (see this link for further details). The number of metrics instrumenting Spark components is quite large. You can find a list of Spark metrics at this link

Step 2: Configuring InfluxDB

  • Download and install InfluxDB 
    • Note: tested in Feb 2019 with InfluxDB version 1.7.3
  • Edit config file /etc/influxdb/influxdb.conf
    • Enable graphite endpoint
  • Key step: Configure the templates, this instructs InfluxDB on how to map data received on the graphite endpoint to the measurements and tags in the DB
  • Optionally configure other InfluxDB parameters of interest as data location and retention
  • Start/restart InfluxDB service: systemctl restart influxdb.service

 
Step 3: Configuring Grafana and prepare/import the dashboard

  • Download and install Grafana 
    • Download the rpm from https://grafana.com/ and start Grafana service: `systemctl start grafana-server.service`
    • Note: tested in Feb 2019 using Grafana 6.0.0 beta.
  • Alternative: run Grafana on a Docker container
  • Connect to the Grafana web interface as admin and configure
    • By default: http://yourGrafanaMachine:3000
    • Create a data source to connect to InfluxDB. 
      • Set the http URL with the correct port number, default: http://yourInfluxdbMachine:8086
      • Set the InfluxDB database name: default is graphite (no password)
    • Key step: Prepare the dashboard. 

 
Step 4: Preparing Spark configuration to sink metrics to graphite endpoint in InfluxDB

 
There are a few alternative ways on how to do this, depending on your environment and preferences. One way is to set a list of configuration parameters of the type "spark.metrics.conf.xx" another is editing the file $SPARK_CONF_DIR/metrics.properties
Configuration for the metrics sink need to be available to all the components being traced, as each component will connect directly to the sink. See details at Spark_metrics_config_options. Example:

$SPARK_HOME/bin/spark-shell \
--conf "spark.metrics.conf.driver.sink.graphite.class"="org.apache.spark.metrics.sink.GraphiteSink" \
--conf "spark.metrics.conf.executor.sink.graphite.class"="org.apache.spark.metrics.sink.GraphiteSink" \
--conf "spark.metrics.conf.*.sink.graphite.host"="graphiteEndPoint_influxDB_hostName>" \
--conf "spark.metrics.conf.*.sink.graphite.port"=<graphite_listening_port> \
--conf "spark.metrics.conf.*.sink.graphite.period"=10 \
--conf "spark.metrics.conf.*.sink.graphite.unit"=seconds \
--conf "spark.metrics.conf.*.sink.graphite.prefix"="lucatest" \
--conf "spark.metrics.conf.*.source.jvm.class"="org.apache.spark.metrics.source.JvmSource"


Step 5: Test/understand the metrics for performance troubleshooting

 
The configuration is finished, now you are ready to test the dashboard. Run Spark using the configuration as in Step 4 and start a test workload. Open the web page of the Grafana dashboard:
  • A drop-down list should appear on top left of the dashboard page, select the application you want to monitor. Metrics related to the selected application should start being populated as time and workload progresses.
  • If you use the dashboard to measure a workload that has already been running for some time, note to set the Grafana time range selector (top right of the dashboard) to a suitable time window
  • For best results test this using Spark 2.4.0 or higher (note Spark 2.3.x will also work, but it will not populate executor JVM CPU)
  • Avoid local mode and use Spark with a cluster manager (for example YARN or Kubernetes) when testing this. Most of the interesting metrics are in the executor source, which is not populated in local mode (up to Spark 2.4.0 included). 
 
Dashboard view:
The following links show an example and general overview of the example dashboard, measuring a test workload. You can find there a large number of graphs and gauges, however, this is still a selection of the many available metrics in Spark instrumentation. The test workload is Spark TPCDS benchmark at scale 100 GB, running on a test YARN cluster, using 24 executors, with 5 cores and 12 GB of RAM each.

 
Example Graphs

 
The next step is to further drill down in understanding Spark metrics, the dashboard graphs and in general investigate how the dashboard can help you troubleshoot your application performance. One way to start is to run a simple workload that you can understand and reproduce. In the following you will find example graphs from a simple Spark SQL query reading a Parquet table from HDFS.
  • The query used is spark.sql("select * from web_sales where ws_list_price=10.123456").show
  • web_sales is a 1.3 TB table from the Spark TPCDS benchmark](https://github.com/databricks/spark-sql-perf) generated at scale 10000 GB.
  • What the query does is reading the entire table, applying the given filter and finally returning an empty result set. This query is used as a "trick to the Spark engine" to force a full read of the table and intentionally avoiding optimization, like Parquet filter pushdown.
  • This follows the discussion of Diving into Spark and Parquet Workloads, by Example
  • Infrastructure and resources allocated: the Spark Session ran on a test YARN cluster, using 24 executors, with 5 cores and 12 GB of RAM each.
 
Graph: Number of Active Tasks


Graph: Number of Active Tasks
One key metric when troubleshooting distributed workloads is the graph of the number of active sessions as a function of time. This shows how Spark is able to make use of the available cores allocated by the executors.

Graph: JVM CPU Usage

Graph: JVM CPU Usage*
CPU used by the executors is another key metric to understand the workload. The dashboard also reports the CPU consumed by tasks, the difference is that the CPU consumed by the JVM includes for example of the CPU used by Garbage collection and more.
Garbage collection can take an important amount of time, in particular when processing large amounts of data as in this case, see Graph: JVM Garbage Collection Time

Graph: Time components

Graph: Time components
Decomposing the run time in component run time and/or wait time can be of help to pinpoint the bottlenecks. In this graph you can see that CPU time and Garbage collection are important components of the workload. A large component of time, between the "executor run time" and the sum of "cpu time and GC time" is not instrumented. From previous studies and by knowing the workload, we can take the educated guess that this is the read time. See also the discussion at Diving into Spark and Parquet Workloads, by Example

Graph: HDFS read throughput

Graph: HDFS read throughput
Reading from HDFS is an important part of this workload. In this graph you can see the measured throughput using HDFS instrumentation exported via the Spark metrics system into the dashboard.

Lessons learned

 
- The dashboard provides many useful insights on Spark workload:

  • It allows to measure and visualize the time profile of resource utilization, starting from the number of concurrent tasks, to CPU, I/O and shuffle metrics.
  • Additional info is provided on time spent (or time waited) by Spark workload per component.
  • The most useful metrics for the cases I used Spark performance dashboard appear to come from the executor source.

- Understanding the dashboard graphs is still the domain of the dashboard user/performance analysis.

  • The dashboard does not directly provide root cause analysis, nor finds bottlenecks. However it helps the user to do that.
  • The dashboard is only as good as the metrics that feed it. Interference can have many forms, for example when running on highly-loaded systems.
  • This work is still experimental. For example we noticed that in certain cases metric values seem wrong and/or hard to understand (see also issues with task executor metrics described below)


- Spark task executor metrics contain very important information, but come with additional complexity

  • Task metrics are cumulative, which means that for many graphs you want to compute deltas, for example with InfluxQL this can be done with the function non_negative_derivative.
  • Task metrics values are incremented only at the end of each task. This may create an issue that affects workload graphs of jobs where task duration is greater than metric data input rate. As a workaround, tune spark.metrics.conf.*.sink.graphite.period (the suggested value in Step 2 is to set this to 10s).
  • Task metrics are updated only for successful tasks. Workload metrics of failed tasks are not visible in the task metrics graphs.

Templates for the graphite endpoint of InfluxDB are very important

  • Templates allow to structure incoming metrics data into InfluxDB tables. 
  • The proposed template values in the example have been set up by experimentation, they are still being developed: see details in Step 2 and in particular InfluxDB graphite endpoint configuration snippet.

- There are many areas in which this work can be improved both on the Apache Spark side and the metrics collection/visualization side. Some random notes on this:

  • Annotations linking Spark job information with metrics with job information would be useful to help drilling down on the workload. This for example on how to answer questions like: "I see an increase in CPU usage at time XX, which query/job/stage caused that?"  (note added, this has been since addressed, see this link).
  • Many components of the time spent/time waited are not directly instrumented in Apache Spark yet: think I/O read time. Also time and resources consumed outside the JVM (for example by Python UDF) are not instrumented
  • The Graphite endpoint does not use a password. It would be advisable to have a full InfluxDB sink in Apache Spark, including full credential connectivity support, rather than using the graphite endpoint.

CERN Spark service experience
  

  • We have installed and provide a shared dashboard as an experimental offering to the users of CERN Spark service (both for Spark on YARN/Hadoop and Spark on Kubernetes).
  • We have worked with Spark community to push a few improvements to the instrumentation, as discussed here, in particular exposing Spark task metrics with the Dropwizard metrics system: SPARK-22190,  SPARK-25228SPARK-25277SPARK-26890
  • We have also used the dashboard in the context of a project for data analysis at scale (up to 800 concurrent cores). In that context we have also introduced custom instrumentation/metrics to Spark and the monitoring dashboard, which has proved to be easily extensible and customizable.

 
Conclusions

 
You find in this post the details of how to build a performance dashboard for Apache Spark workloads. The dashboard can provide important insights for performance troubleshooting and real-time monitoring of Apache Spark workloads. The implementation on Spark metrics system integrated with InfluxDB and Grafana. In addition you can find links to details of the available metrics instrumentation, configuration details for InfluxDB and examples of Grafana dashboard and graphs that you can use a starting point for  further exploration.
We wish you a fruitful time monitoring and troubleshooting Spark, if you find some mistakes of good additions to the dashboard that you want to share, we will be happy to hear from you.

Acknowledgments: this work has been developed in the context of the data analytics services with Apache Spark, Hadoop and streaming at CERN IT, thanks to the collaboration of several colleagues in the teams. Contacts for questions about this work: Luca.Canali@cern.ch and Prasanth.Kothuri@cern.ch