Monday, May 21, 2012

SQL Patch and Force Match

Discussion on how to create sql_patch with force_match=true in Oracle 11g and related topics.

SQL patches have recently saved the day for me in a production issue where a given SQL had suddenly changed execution plan causing IO overload (a full scan was done instead of index-based read for a high-load statement). 11g allows for a quick fix in such situations (as in, stop the fire and buy time to find a more stable solution): a set of hints can be added to a given query via the use of SQL Patch.
The official Oracle documentation has not many details on the topic (up to 11.2.0.3). Oracle's optimizer blog and Dominic Brooks have very good posts on the topic though.
I add here a few additional details that I have researched and found useful:


1) Recap (from the references listed above): how to create a SQL_PATCH from command line 

begin
 sys.dbms_sqldiag_internal.i_create_patch
  (sql_text  => '..put SQL here..',
   hint_text => '..put hints here..',
   name      => 'my patch name'); 
end;
/

2) What if I have a sql_id instead of the sql_text?

SQL> var c clob
SQL> exec select sql_fulltext into :c from v$sqlstats where sql_id='...' and rownum=1;

begin
 sys.dbms_sqldiag_internal.i_create_patch
  (sql_text  => :c,
   hint_text => '..put hints here..',
   name      => 'my patch name'); 
end;
/


3) What if I want to create a SQL patch with FORCE_MATCH = TRUE? (force match will additionally target all SQL statements that have the same text after normalizing literal values to bind variables). 

-- create sql patch
-- allows to set FORCE_MATCH to TRUE which is currently not possible with dbms_sqldiag_internal.i_create_patch (11.2.0.3)
-- run as sys
-- this is undocumented stuff, handle with care

DECLARE
    sql_text clob            := '....put sql here...';
    hints    varchar2(1000)  :='....put hints here...';
    description varchar2(100):='my patch description';
    name varchar2(100)       :='my patch name';
    output   varchar2(100);
    sqlpro_attr SYS.SQLPROF_ATTR;
  
BEGIN
    sqlpro_attr := SYS.SQLPROF_ATTR(hints);
    output      := SYS.DBMS_SQLTUNE_INTERNAL.I_CREATE_SQL_PROFILE(
      SQL_TEXT => sql_text,
      PROFILE_XML => DBMS_SMB_INTERNAL.VARR_TO_HINTS_XML(sqlpro_attr),
      NAME => name,       DESCRIPTION => description,     
      CATEGORY => 'DEFAULT',
      CREATOR => 'SYS',
      VALIDATE => TRUE,
      TYPE => 'PATCH',
      FORCE_MATCH => TRUE,
      IS_PATCH => TRUE);
    dbms_output.put_line(output);
  END;
/

4) Additional considerations:
What should I put as hints in the SQL PATCH? I would normally use the full outline content from an execution plan that I have tested and found OK. Mileage may vary. To print out the outline one can use:
select * from table(dbms_xplan.display('PLAN_TABLE',null,'OUTLINE'));

Drop and enable/disable SQL patches with: DBMS_SQLDIAG.DROP_SQL_PATCH and DBMS_SQLDIAG.ALTER_SQL_PATCH

Diagnostics:  dba_sql_patches. That view is based on tables shared with sql profiles and sql baselines. Underlying tables of interest for baselines, profiles and sql patches are: sys.sqlobj$data sys.sqlobj$auxdata, sys.sql$text, sys.sqlobj$
V$SQL.SQL_PATCH when not null reports the name of the sql patch that has been used to parse that particular child cursor.

Monday, May 14, 2012

V$EVENT_HISTOGRAM_METRIC

V$EVENT_HISTOGRAM_METRIC does not exist (at least up to 11.2.0.3) however it could be handy! The idea is combine the detailed information from event histograms and the ease of use of metric views. Here below an example of how this can be implemented with a sample script and a reference to the code of the script.

Example: Measure latency for single block reads for an OLTP database, as exposed by Oracle wait event interface as 'db file sequential read'. This is used to investigate a case of performance degradation where storage behaviour is involved.

Step 1: collect GV$EVENT_HISTOGRAM data in a period of normal activity using the script ehm.sql


Step 2: Plot data and analysis. Roughly 30 % of the reads are accounted as being competed in less than 1 ms. Those reads are being served from the SSD cache of the storage. A peak of latency is around 16 ms. We can interpret that as reads from physical disks (SATA disks at 7.2K rpm, that's why not very fast BTW)


Step 3: collect GV$EVENT_HISTOGRAM data during a period when applications report performance issues and plot data.

Analysis: Data measured in step 3 show that there are almost no blocks read from the SSD cache (that is there is no peak around the 1 ms measurement point) and that reads from physical IO have very high latency and definitely higher latency than normal (compare with graph above).
Note: This is the same case as discussed in a previous blog entry, see there for further details analisys of the investigations on what triggers this type of behaviour in the storage: "Of latency, skew and histograms 2/2"


The point I want to make: event histogram data gives valuable information for troubleshooting. In particular I have found useful the study of db file sequential read event. I is important to collect data samples over an interval of time of interest, as opposed to using raw data from gv$event_histogram that are cumulative since instance(s) startup.

This article describes the use of the script ehm.sql v1.0. A newer version has been released since. Both the old and new version can be found at this link.

Monday, May 7, 2012

Performance Metrics Views

Topic: GV$ views of the 'metrics family' and how they can help in tuning + links to scripts I use.

Oracle has plenty of instrumentation, statistics counters and wait event data are the bread and butter of Oracle monitoring and tuning.
However counters are typically incremented during the life of the instances/sessions, so delta values are often needed to make sense of data for analysis. AWR reports are a way to do that for instance-wide data.
A class of GV$ views that can be of help for faster/ 'online' monitoring are the V$ views that I call of the 'metric family'. Of those I find myself using often: gv$sysmetric, gv$eventmetric and gv$iofuncmetric
The great thing about metrics is that they report values accumulated over shorts period of times (15 and 60 sec are typical).  Effectively this provides the needed deltas.
Still one minor problem: a lot of data is reported by the metrics, more than what is needed normally. So a good filtering of the metrics of interest can be helpful.
Below a few examples of scripts that I have written and I use for this. (Scripts can be found here).

Examples:
sysmetric_details.sql reports on a dozen of metrics and lists values for instance (in RAC).


GV$IOFUNCMETRIC is new in 11gR2 and provides details on the type of IO the system is doing. An example below. This time iometric.sql aggregates over all instances of RAC.


Conclusions: gv$ views of the metric family provide a very useful set of tools for reactive performance analysis. They provide a quick view of key metrics, events consumed and IO done.
Limitations: views of the metric family don't provide a session-based view or a SQL-based view. They are often  more useful for finding the symptoms rather than the root causes of performance issues.

Monday, April 30, 2012

Of I/O Latency, Skew and Histograms 2/2

Case: This is part 2/2 of a performance investigation. In the previous part we have seen how the sudden increase of single block read latency would harm performance of the production database and how this would appear consistently when taking backups.

Drill down questions: what causes the high latency for single block reads during backup? Why do the sequential IO of the backup causes random reads to slow down? Are disks saturating? Is it an Oracle issue or more a storage issue? Finally, what can be done about it?

Oracle event histogram: Oracle instrumentation of wait events provides additional information in terms of histograms. Wait duration is divided in intervals and for each interval we can see how many wait events have happened. Historical data is collected and visible in AWR.

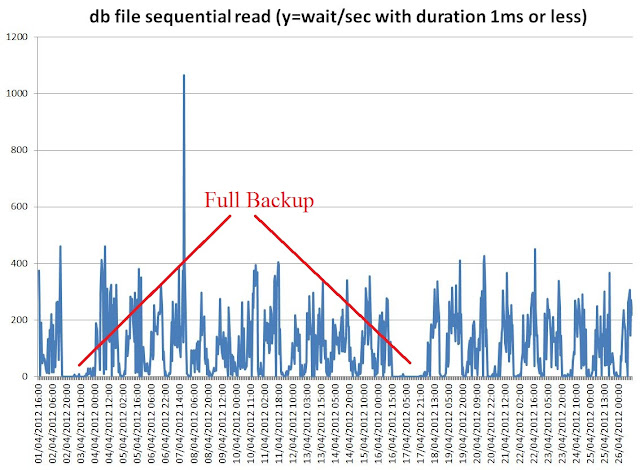
AWR data: Graph of data from DBA_HIST_EVENT_HISTOGRAM for the event db file sequential read are reported here below. In particular we can see that read of 1ms or less, that is reads served by the SSD cache of the storage, go to zero during the time backups are taken. Moreover wait of long duration (between 64 and 128 ms, which is a very long time for single block reads) show a peak at the same time.


Graph1: "Number of single block reads of 64 ms or more (that is very slow)" plotted as function of time. Large peaks are seen in correspondence of full backups (every 2 weeks), smaller peaks during daily backups.

 Graph2: "Number of single block read of 1 ms or less (that is blocks read from the SSD cache of the storage)" plotted as a function of time. Reading from the cache can be seen to go to zero during backups full backups (every two weeks, see also graph 1).

First conclusions and future work: IO becomes slow because backups effectively seem to flush the SSD cache. Also Very long response times are seen from single block IO. There is work to do on the storage side!
What about actions on the DB? Moving backup to the (active) Data Guard, can be of help, as it would effectively remove the workload source of contention.


Techniques and references: To analyze AWR data I have built a set of custom queries against dba_hist_* views and used them inside the excellent Perfsheet by Tanel Poder.
Moreover I'd like to reference James Morle's blog
This is the text of the query used, among others, to generate the graph above:

--event histogram with wait_count rate and time
select cast(sn.begin_interval_time as date) beg_time,
    eh.dbid,
    sn.instance_number,
    eh.event_name,
    eh.wait_time_milli,
    eh.wait_count,
    eh.wait_count - lag(eh.wait_count) over (partition by eh.dbid,eh.instance_number,eh.event_id,eh.wait_time_milli order by sn.snap_id nulls first) Delta_wait_count,
    extract(hour from END_INTERVAL_TIME-begin_interval_time)*3600
              + extract(minute from END_INTERVAL_TIME-begin_interval_time)* 60
              + extract(second from END_INTERVAL_TIME-begin_interval_time) DeltaT_sec,
    round((eh.wait_count - lag(eh.wait_count) over (partition by eh.dbid,eh.instance_number,eh.event_id,eh.wait_time_milli order by sn.snap_id nulls first)) /
          (extract(hour from END_INTERVAL_TIME-begin_interval_time)*3600
              + extract(minute from END_INTERVAL_TIME-begin_interval_time)* 60
              + extract(second from END_INTERVAL_TIME-begin_interval_time)),2 ) Rate_wait_count_per_bin
from dba_hist_event_histogram eh,
     dba_hist_snapshot sn
where
%FILTER%
and sn.snap_id = eh.snap_id
and sn.dbid = eh.dbid
and sn.instance_number = eh.instance_number
and sn.begin_interval_time between %FROM_DATE% and %TO_DATE%

Thursday, April 26, 2012

Of I/O Latency, Skew and Histograms 1/2


This is a performance investigation of Oracle DB and interaction with storage. 

Case: DB operations are slow during backup. The system is an OLTP-like workload, IO bound. Most of the reads are via indexes, typically single-block access, not much full scan.The system has still many free CPU cycles.  
First analysis: single block read times jump to very high values when backups start.
Tools: Use AWR data, to plot db file sequential read wait time over an interval of about 3 weeks. Large spikes can be seen during full DB backup. Spikes are also seen daily when incremental backup starts (see graph below)


Graph: average time spent on db file sequential read events aggregated per hour and plotted as as function of time. High and large spikes of IO latency can be seen during full backups. Smaller spikes during daily incremental backups.

Conclusions from first analysis: Users most important queries are IO latency-bound, latency jumps up during backups, therefore this explains the slowdown seen by the users.

Drill down: We want to understand why IO is slow during backup. Is it some sort of 'interference' of the sequential IO of the backup with random IO of the users? Is it an Oracle problem or a storage problem?
Main idea: use event histogram values reported by Oracle instrumentation to study skew on IO access time and find more about the root cause of the issue. Investigations: see part 2 of this blog entry.

Techniques and references: To analyze AWR data I have built a set of custom queries against dba_hist_* views and used them inside the excellent Perfsheet by Tanel Poder.
This is the text of the query used, among others, to generate the graph above:


-- system_event with rate and time
select cast(sn.begin_interval_time as date) beg_time,
    ss.dbid,
    sn.instance_number,
    ss.event_name,
    ss.wait_class,
    ss.total_waits,
    ss.time_waited_micro,
    ss.total_waits - lag(ss.total_waits) over (partition by ss.dbid,ss.instance_number,ss.event_id order by sn.snap_id nulls first) Delta_waits,
    ss.time_waited_micro - lag(ss.time_waited_micro) over (partition by ss.dbid,ss.instance_number,ss.event_id order by sn.snap_id nulls first) Delta_timewaited,
    extract(hour from END_INTERVAL_TIME-begin_interval_time)*3600
              + extract(minute from END_INTERVAL_TIME-begin_interval_time)* 60
              + extract(second from END_INTERVAL_TIME-begin_interval_time) DeltaT_sec,
    round((ss.total_waits - lag(ss.total_waits) over (partition by ss.dbid,ss.instance_number,ss.event_id order by sn.snap_id nulls first)) /
          (extract(hour from END_INTERVAL_TIME-begin_interval_time)*3600
              + extract(minute from END_INTERVAL_TIME-begin_interval_time)* 60
              + extract(second from END_INTERVAL_TIME-begin_interval_time)),2 ) Waits_per_sec,
    round((ss.time_waited_micro - lag(ss.time_waited_micro) over (partition by ss.dbid,ss.instance_number,ss.event_id order by sn.snap_id nulls first)) /
          (extract(hour from END_INTERVAL_TIME-begin_interval_time)*3600
              + extract(minute from END_INTERVAL_TIME-begin_interval_time)* 60
              + extract(second from END_INTERVAL_TIME-begin_interval_time)),2 ) Rate_timewaited,  -- time_waited_microsec/clock_time_sec
    round((ss.time_waited_micro - lag(ss.time_waited_micro) over (partition by ss.dbid,ss.instance_number,ss.event_id order by sn.snap_id nulls first)) /
           nullif(ss.total_waits - lag(ss.total_waits) over (partition by ss.dbid,ss.instance_number,ss.event_id order by sn.snap_id nulls first),0),2) Avg_wait_time_micro
from dba_hist_system_event ss,
     dba_hist_snapshot sn
where
%FILTER%
and sn.snap_id = ss.snap_id
and sn.dbid = ss.dbid
and sn.instance_number = ss.instance_number
and sn.begin_interval_time between %FROM_DATE% and %TO_DATE%

Wednesday, April 18, 2012

Uno

This is the first entry of this blog. Just to see if all works and to tune the layout. The blog will cover Oracle and databases. In particular tuning and internals.