Showing posts with label AWR. Show all posts

Thursday, February 25, 2016

PerfSheet.js: Oracle AWR Data Visualization in the Browser with JavaScript Pivot Charts

PerfSheet.js is a tool aimed at DBAs and Oracle performance analysts. It provides a simplified interface to extract and visualize AWR time series data in the browser using javascript.

The reason for a tool like PerfSheet.js is to make the analysis of AWR data easier by providing a graphical interactive interface and by automating several repetitive steps of data extraction and chart preparation. Pivot charts provide a flexible and easy to use way to navigate around the many metrics and dimensions of AWR data. PerfSheet4 is a tool that I have been using for a few years for AWR data analysis (following previous original work by Tanel Poder).
PerfSheet.js spins off from the work on PerfSheet4. While PerfSheet4 runs in MS Excel. PerfSheet.js is written in javascript and runs in the browser. This provides extra flexibility and compatibility across platforms.
The main components of PerfSheet.js are:
  • Visualization with interactive pivot charts. This is implemented using  PivotTable.js by Nicolas Kruchten.
  • Additional customization provide pre-configured starter charts and a basic interface to load data from CSV files.
  • A set of SQL scripts to extract performance metrics of interest from Oracle AWR tables into CSV files.
  • A few example data files come with the tool, to help first-time users.

You can download PerfSheet.js from Github or from this webpage.

Here is a screenshot of PerfSheet.js:


Here is an introductory video:


References and acknowledgements

PerfSheet.js is based on PivotTable.js by Nicolas Kruchten. Additional dependencies include: C3.js, D3.js, jQuery, jQuery-ui, PapaParse. PerfSheet.js is based on previous work on PerfSheet4 which in turn is based on original work by Tanel Poder.


Monday, October 28, 2013

Daylight Saving Time Change and AWR Data Mining

Topic: this article is about a tip for Oracle 11.2 and higher on how to handle DST change when querying directly the AWR repository. In addition a few comments on PerfSheet 4, a tool to extract and plot AWR data in Excel.

Introduction: Statspack and more recently AWR reports, are standard performance data sources for Oracle practitioners. AWR analytics/data mining brings an additional powerful set of techniques to understand database workloads and performance when instance-wide analysis is relevant. If you are new to this topic, see for example this presentation by Jury Velikanov.

SQL techniques
One of the SQL techniques that is commonly used when extracting data from AWR is the use of analytic functions (see also this presentation by Connor McDonald) to calculate "deltas" between data points for consecutive snapshots of V$ views stored in AWR. I mean something like this:

...value - lag(value) over (partition by dbid,instance_number,stat_id order by snap_id nulls first) 

Moreover it is quite useful to calculate ratios of such delta values over the time elapsed between two snapshots. How can we calculate the seconds between two snapshots? With something like this:

(extract(hour from END_INTERVAL_TIME-begin_interval_time)*3600 + ...add similar terms for minutes and seconds..

DST changes can cause trouble
What has all this got to do with daylight saving time changes?
The problem we are trying to solve here is, for example that in the fall, when moving back the clock one hour, we have 2 consecutive snapshots at 2:00 am. The time interval between the snapshots calculated with the simple formula above becomes zero (actually it would normally be a number close to zero by a handful of seconds and it can also be negative) and this calls for trouble when we want to divide our delta values by the snapshot time interval.

A solution for 11.2 and higher
Oracle 11.2 and higher provide a simple solution by introducing an extra column in the dba_hist_snapshot view (and underlying table WRM$_SNAPSHOT): SNAP_TIMEZONE, the "Snapshot time zone expressed as offset from UTC (Coordinated Universal Time) time zone".
This new column allows to write a simple 'patch' to our computation of the time difference to account for daylight saving changes:

...-extract(hour from snap_timezone - lag(snap_timezone)) 

Example
Here below an example from DBA_HIST_SNAPSHOT for a database server that has changed from CEST (Central European Summer Time) to CET on Sunday October 27th, 2013. Note that the SNAP_TIMEZONE value changes from UTC+2 to UTC+1. Note also that for SNAP_ID=13843 both begin_interval_time and end_interval_time are set to 2am. More precisely the end interval appears to have happened almost 20 seconds before the begin interval, as explained above this need to be corrected with the SNAP_TIMEZONE difference.


Mining AWR data
I find mining AWR data a very useful data source for performance tuning (when instance-wide data is appropriate). It is quite worth the effort to develop a set of scripts for AWR mining to be used when the need comes. Some pointers: my set of scripts can be downloaded from this link (it is packaged together with Perfsheet4). Another very good set of AWR scripts can be found at Karl Arao's website.

Perfsheet4 
Perfsheet 4 is a tool I have written and published in February 2013 with the goal of providing a simple point-and-click data mining tool for Oracle AWR data. It is a fork of Perfsheet 3.0 by Tanel Poder and comes with a few packaged queries to extract data from AWR and visualize it as line graphs. The power of the tool is that it automates some boring details of writing queries to extract AWR data and import the results in Excel and brings the user straight to Excel's pivot charts: a simple but also quite powerful aggregation and visualization engine.
The queries used in Perfsheet4 can be seen/customized in the Excel spreadsheet and are also available as text files in the zip file. You can see there that I have used the 11.2 new attribute of snap_timezone. This has come for a price though: the compatibility with 11.1 and 10.2 databases is broken (only Oracle 11.2 and higher will run the supplied scripts).

A basic example here below of how to use PerfSheet 4 in his latest version as I write this (v3.3):


Thursday, February 14, 2013

AWR Analytics and Oracle Performance Visualization with PerfSheet4

Topic: This post describes PerfSheet4, a tool for performance analysis aimed at streamlining access and visualization of Oracle's AWR data. The tool is aimed at DBAs and Oracle performance analysts. PerfSheet4 is a spin off of previous original work by Tanel Poder, rewritten and integrated with additional functionality for AWR analysis and with important changes to the user interface.

Note added: An update to this post with the details of a more recent version of PerfSheet4 can be found at this link. See also the work on PerfSheet.js.

Context: There is much information in the counters and metrics of Oracle's AWR that can be of substantial help for troubleshooting and for capacity planning. Besides the standard AWR report, time-based analysis is often very useful. However this type of access is made slow and tedious by a list of tasks, such as, fetching data, calculating incremental changes and producing interesting graphs.This normally requires developing or downloading a bunch of scripts and adding some visualization techniques on top. See for example Karl Arao's scripts and blog.
Tanel Poder has already demonstrated a few years ago that the pivot chart functionality of Excel can be an excellent platform for performance data visualization including AWR (and Perfstat) data. See his work on  Perfsheet 2.0 and PerfSheet3.

What's new: The main drive to develop PerfSheet4 was to (try to) make the user interface as simple as possible, without compromising the general nature of the tool. A set of pre-defined queries for some common AWR analysis come with the tool. The plotting functionality will generate custom graphs for such data, an easy entry point to analysis.
If direct access to the DB is not possible, data can be extracted from the DB with the scripts supplied in the sql*plus_scripts directory and then loaded as csv. Similarly, export to csv can be used to archive data for later analysis.

PerfSheet4 is a free tool and is available for download from GitHub or download from this link. The tool has been developed and tested on Excel 2010 against Oracle 11gR2. See here below a snapshot of the user interface with some additional details.


Why Excel: Pivot tables and charts are a great feature available in Excel that allows to quickly and easily analyze multidimensional data. This can be of great help when troubleshooting problems in production, for example with the need to try out different ideas and data combinations

Why pre-defined graphs: This feature is again to make life easier for the user. The idea is to automates the tedious task of setting up the pivot chart fields and provides an entry point to get to the needed graph.


Available queries: version 3.2p beta comes with the following queries (and pre-defined graphs):

Query name name Short description
Wait events Extracts data from dba_hist_system_event, computes delta values between snapshots and rates (i.e. delta values divided over delta time)
System statistics Extracts data from dba_hist_sysstat, computes delta values between snapshots and rates (i.e. delta values divided over delta time)
Stats per service Extracts data from dba_hist_service_stat, computes delta values between snapshots and rates (i.e. delta values divided over delta time)
Workload data Extracts data from dba_hist_sysmetric_summary, metrics give details on the usage of system resources over time ranges
IO wait latency Extracts data from dba_hist_event_histogram for io related events, computes delta values between snapshots and rates (i.e. delta values divided over delta time)
Top 5 wait per instance Extracts data from dba_hist_system_event and dba_hist_sysstat, computes delta values and rates (delta value over delta time) and selects top 5 non idle events for each instance
Wait events per class Extracts data from dba_hist_system_event, computes delta values and rates (delta value over delta time) aggregating over wait class


Future work: Stabilize Perfsheet4 against bugs and for different execution environments. For this feedback from other users would be very much appreciated. Possibly add more pre-defined queries (for AWR analytics but not necessarily only that). Add a post with examples of how analysis performed with PerfSheet4 have been useful for my job in various occasions. In the mean time if you find the tool useful or find bugs or have ideas for possible improvements, I'll be interested to know! Acknowledgments: Many thanks to Tanel Poder, the co-author of the tool.

Getting started video: http://youtu.be/kC0EJCLZWIw


Monday, April 30, 2012

Of I/O Latency, Skew and Histograms 2/2

Case: This is part 2/2 of a performance investigation. In the previous part we have seen how the sudden increase of single block read latency would harm performance of the production database and how this would appear consistently when taking backups.

Drill down questions: what causes the high latency for single block reads during backup? Why do the sequential IO of the backup causes random reads to slow down? Are disks saturating? Is it an Oracle issue or more a storage issue? Finally, what can be done about it?

Oracle event histogram: Oracle instrumentation of wait events provides additional information in terms of histograms. Wait duration is divided in intervals and for each interval we can see how many wait events have happened. Historical data is collected and visible in AWR.

AWR data: Graph of data from DBA_HIST_EVENT_HISTOGRAM for the event db file sequential read are reported here below. In particular we can see that read of 1ms or less, that is reads served by the SSD cache of the storage, go to zero during the time backups are taken. Moreover wait of long duration (between 64 and 128 ms, which is a very long time for single block reads) show a peak at the same time.


Graph1: "Number of single block reads of 64 ms or more (that is very slow)" plotted as function of time. Large peaks are seen in correspondence of full backups (every 2 weeks), smaller peaks during daily backups.

 Graph2: "Number of single block read of 1 ms or less (that is blocks read from the SSD cache of the storage)" plotted as a function of time. Reading from the cache can be seen to go to zero during backups full backups (every two weeks, see also graph 1).

First conclusions and future work: IO becomes slow because backups effectively seem to flush the SSD cache. Also Very long response times are seen from single block IO. There is work to do on the storage side!
What about actions on the DB? Moving backup to the (active) Data Guard, can be of help, as it would effectively remove the workload source of contention.


Techniques and references: To analyze AWR data I have built a set of custom queries against dba_hist_* views and used them inside the excellent Perfsheet by Tanel Poder.
Moreover I'd like to reference James Morle's blog
This is the text of the query used, among others, to generate the graph above:

--event histogram with wait_count rate and time
select cast(sn.begin_interval_time as date) beg_time,
    eh.dbid,
    sn.instance_number,
    eh.event_name,
    eh.wait_time_milli,
    eh.wait_count,
    eh.wait_count - lag(eh.wait_count) over (partition by eh.dbid,eh.instance_number,eh.event_id,eh.wait_time_milli order by sn.snap_id nulls first) Delta_wait_count,
    extract(hour from END_INTERVAL_TIME-begin_interval_time)*3600
              + extract(minute from END_INTERVAL_TIME-begin_interval_time)* 60
              + extract(second from END_INTERVAL_TIME-begin_interval_time) DeltaT_sec,
    round((eh.wait_count - lag(eh.wait_count) over (partition by eh.dbid,eh.instance_number,eh.event_id,eh.wait_time_milli order by sn.snap_id nulls first)) /
          (extract(hour from END_INTERVAL_TIME-begin_interval_time)*3600
              + extract(minute from END_INTERVAL_TIME-begin_interval_time)* 60
              + extract(second from END_INTERVAL_TIME-begin_interval_time)),2 ) Rate_wait_count_per_bin
from dba_hist_event_histogram eh,
     dba_hist_snapshot sn
where
%FILTER%
and sn.snap_id = eh.snap_id
and sn.dbid = eh.dbid
and sn.instance_number = eh.instance_number
and sn.begin_interval_time between %FROM_DATE% and %TO_DATE%

Thursday, April 26, 2012

Of I/O Latency, Skew and Histograms 1/2


This is a performance investigation of Oracle DB and interaction with storage. 

Case: DB operations are slow during backup. The system is an OLTP-like workload, IO bound. Most of the reads are via indexes, typically single-block access, not much full scan.The system has still many free CPU cycles.  
First analysis: single block read times jump to very high values when backups start.
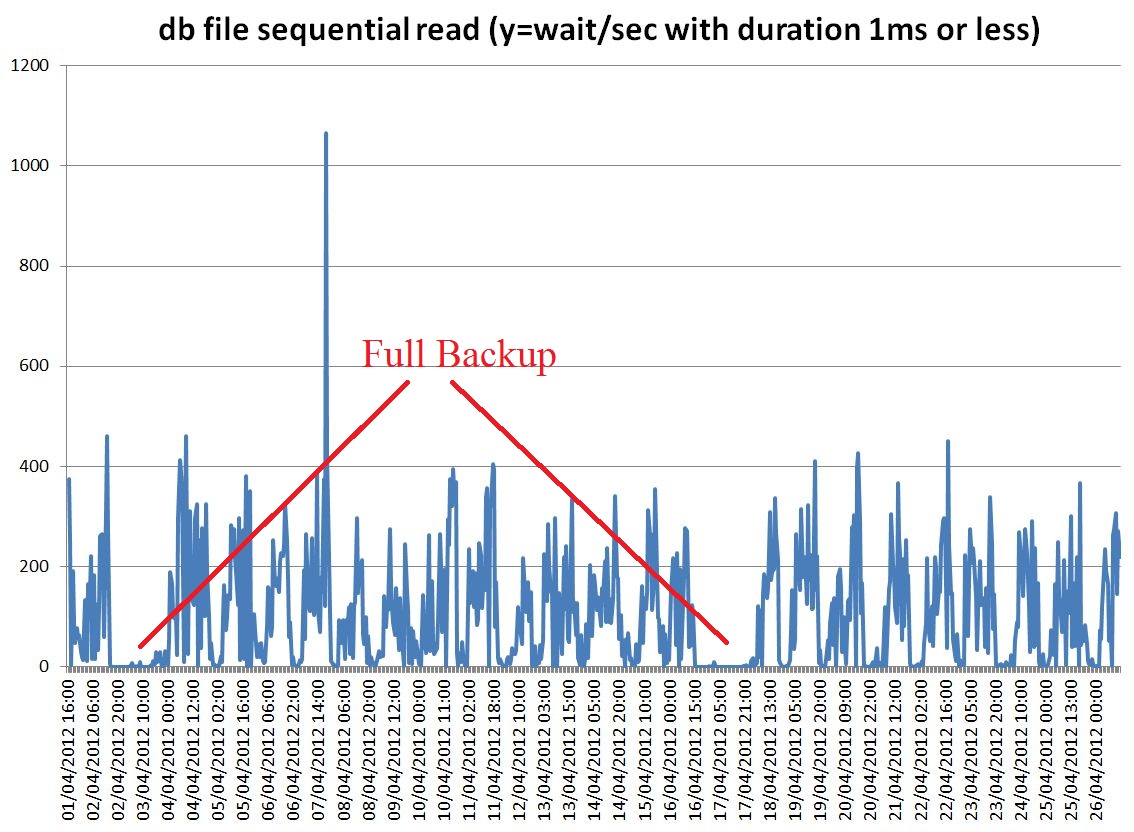
Tools: Use AWR data, to plot db file sequential read wait time over an interval of about 3 weeks. Large spikes can be seen during full DB backup. Spikes are also seen daily when incremental backup starts (see graph below)


Graph: average time spent on db file sequential read events aggregated per hour and plotted as as function of time. High and large spikes of IO latency can be seen during full backups. Smaller spikes during daily incremental backups.

Conclusions from first analysis: Users most important queries are IO latency-bound, latency jumps up during backups, therefore this explains the slowdown seen by the users.

Drill down: We want to understand why IO is slow during backup. Is it some sort of 'interference' of the sequential IO of the backup with random IO of the users? Is it an Oracle problem or a storage problem?
Main idea: use event histogram values reported by Oracle instrumentation to study skew on IO access time and find more about the root cause of the issue. Investigations: see part 2 of this blog entry.

Techniques and references: To analyze AWR data I have built a set of custom queries against dba_hist_* views and used them inside the excellent Perfsheet by Tanel Poder.
This is the text of the query used, among others, to generate the graph above:


-- system_event with rate and time
select cast(sn.begin_interval_time as date) beg_time,
    ss.dbid,
    sn.instance_number,
    ss.event_name,
    ss.wait_class,
    ss.total_waits,
    ss.time_waited_micro,
    ss.total_waits - lag(ss.total_waits) over (partition by ss.dbid,ss.instance_number,ss.event_id order by sn.snap_id nulls first) Delta_waits,
    ss.time_waited_micro - lag(ss.time_waited_micro) over (partition by ss.dbid,ss.instance_number,ss.event_id order by sn.snap_id nulls first) Delta_timewaited,
    extract(hour from END_INTERVAL_TIME-begin_interval_time)*3600
              + extract(minute from END_INTERVAL_TIME-begin_interval_time)* 60
              + extract(second from END_INTERVAL_TIME-begin_interval_time) DeltaT_sec,
    round((ss.total_waits - lag(ss.total_waits) over (partition by ss.dbid,ss.instance_number,ss.event_id order by sn.snap_id nulls first)) /
          (extract(hour from END_INTERVAL_TIME-begin_interval_time)*3600
              + extract(minute from END_INTERVAL_TIME-begin_interval_time)* 60
              + extract(second from END_INTERVAL_TIME-begin_interval_time)),2 ) Waits_per_sec,
    round((ss.time_waited_micro - lag(ss.time_waited_micro) over (partition by ss.dbid,ss.instance_number,ss.event_id order by sn.snap_id nulls first)) /
          (extract(hour from END_INTERVAL_TIME-begin_interval_time)*3600
              + extract(minute from END_INTERVAL_TIME-begin_interval_time)* 60
              + extract(second from END_INTERVAL_TIME-begin_interval_time)),2 ) Rate_timewaited,  -- time_waited_microsec/clock_time_sec
    round((ss.time_waited_micro - lag(ss.time_waited_micro) over (partition by ss.dbid,ss.instance_number,ss.event_id order by sn.snap_id nulls first)) /
           nullif(ss.total_waits - lag(ss.total_waits) over (partition by ss.dbid,ss.instance_number,ss.event_id order by sn.snap_id nulls first),0),2) Avg_wait_time_micro
from dba_hist_system_event ss,
     dba_hist_snapshot sn
where
%FILTER%
and sn.snap_id = ss.snap_id
and sn.dbid = ss.dbid
and sn.instance_number = ss.instance_number
and sn.begin_interval_time between %FROM_DATE% and %TO_DATE%