This project showcases:
- A structured approach to data analysis using a handful of short Jupyter Notebooks.
- How Python’s ecosystem (NumPy, Pandas, SciPy, Matplotlib) facilitates computational research.
- The benefits of AI-assisted coding in accelerating development and improving workflow efficiency.
- An interactive, visually engaging reproduction of Kepler’s findings.
The full code and notebooks are available at: GitHub Repository
Jupyter Notebooks and AI-Assisted Coding: A Powerful Combination for Data Science
Jupyter Notebooks have become the standard environment for data science, offering an interactive and flexible platform for scientific computing. They can be run on local machines or cloud services such as Google Colab, Amazon SageMaker, IBM Watson Studio, Microsoft Azure, GitHub Codesopaces, Databricks, etc. CERN users can also run the notebooks on the CERN-hosted Jupyter notebooks service SWAN (Service for Web-based ANalysis), a widely popular service used by engineers and physicists across CERN for large-scale scientific analysis.
How Python and AI Tools Enhance This Project
Data Interpolation & Curve Fitting: Python libraries like SciPy and AI-assisted tools help generate optimal curve fits in seconds.
Plotting & Visualization: AI-driven code completion and Matplotlib make it easier and faster to generate plots.
Error Handling & Debugging: AI suggestions help identify and fix errors quickly, improving workflow efficiency.
Exploring Alternative Approaches: AI can suggest different computational methods, allowing for a more robust and exploratory approach to the analysis.
Why Use Jupyter Notebooks and AI-Assisted Coding?
Saves Time: Avoids writing repetitive, boilerplate code.
Enhances Accuracy: Reduces human error in complex calculations.
Boosts Creativity: Frees up cognitive resources to focus on insights rather than syntax.
Flexible & Scalable: Python notebooks can be used locally or on powerful cloud-based platforms for large-scale computations.
Widely Adopted: Used by researchers, engineers, and data scientists across academia, industry, and institutions like CERN.
Overview of the Analysis
The project is structured into a series of Jupyter notebooks, each building on the previous one to triangulate Mars' orbit and verify Kepler’s laws.
Click on the notebook links below to explore the details of each step.
Notebook Generating Mars Ephemeris
Generate the measurements of Mars' celestial positionsData is key for the success of this analysis, Kepler used Ticho Brahe's data, we are going to use NASA JPL's DE421 ephemeris via the Skyfield library to generate accurate planetary positions over a period of 12 Martian years (approximately 22 Earth years), starting from January 1, 2000.
Determine the ecliptic longitude of Mars and the Sun in the plane of Earth's orbit.Filters out observations where Mars is obscured by the Sun.
Save the filtered ephemeris data into a CSV file (
ephemeris_mars_sun.csv).- Key attributes in the saved data are: Date, Mars Ecliptic Longitude (deg), Sun Ecliptic Longitude (deg)
Notebook Key Insight of Kepler's Analysis
Understand how Earth-based observations reveal Mars’ trajectoryMars completes one full revolution around the Sun in 687 days (one Mars year). During this period, Earth occupies a different position in its orbit at each observation. By selecting measurements taken exactly one Mars year apart, we capture Mars' apparent position from varied vantage points. With enough observations over several Mars years, these multiple perspectives enable us to triangulate the position of Mars.
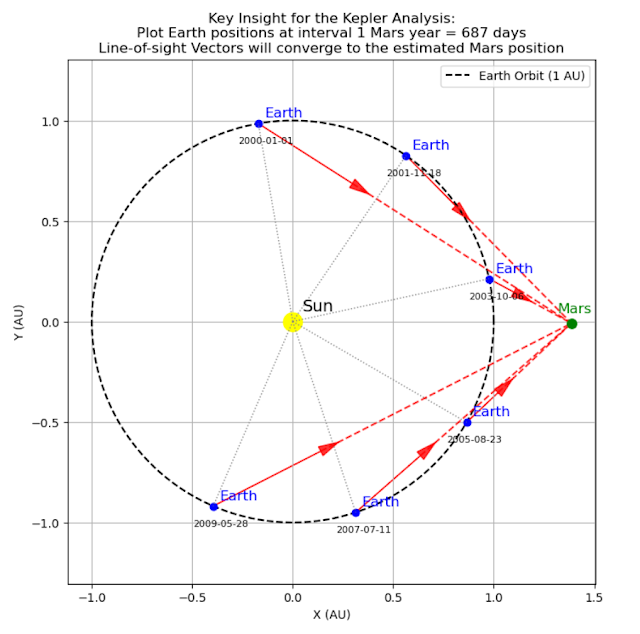
Figure 1, Triangulating Mars' Position:- Select observations spaced 687 days apart (one Mars year) so that Mars is observed at nearly the same position relative to the Sun for each measurement.
- For each observation, compute Earth's position in the ecliptic and derive Mars' line-of-sight vectors.
- Apply least-squares estimation to solve for Mars' ecliptic coordinates.
Notebook Computing Mars' Orbit
Calculate Mars orbit by triangulating Mars' position using all available observations.Load the dataset (
line_of_sight_mars_from_earth.csv) with Mars and Sun observations, notably the following fields: Date, Mars Ecliptic Longitude (deg), and Sun Ecliptic Longitude (deg).Computes Mars' heliocentric coordinates and estimates its orbit.Generalized Triangulation
- For each start date within the first Mars year, iterate through subsequent measurements at 687-day intervals (one Mars year), so that Mars is observed at nearly the same position relative to the Sun for each measurement.
- Triangulate Mars' position from the accumulated data when at least two valid measurements are available.
- Gracefully handle missing data and singular matrices to ensure robust estimation.
- Compile the computed Mars positions into a results DataFrame and save the results to a CSV file (
computed_Mars_orbit.csv) for further analysis.
Notebook Kepler’s Laws
Verify Kepler’s three laws with real data Figure2: Demonstrate Kepler's First Law by fitting an elliptical model to confirm Mars’ orbit is an ellipse with the Sun at one focus. The fitted parameters match accepted values, notable eccentricity e ~ 0.09 and semi-major axis a ~ 1.52 AU.
Second Law: Demonstrate that Mars sweeps out equal areas in equal time intervals using the measured values of Mars' orbit.
Third Law: Validate the harmonic law by comparing the ratio T^2/a^3 for Mars and Earth.
Notebook Estimating Earth's Orbit
Use Mars' ephemeris and line-of-sight data to determine Earth’s orbitEarth Position Computation:
- For each selected observation, compute Earth's heliocentric position by solving for the Earth-Sun distance using the observed Sun and Mars ecliptic longitudes and the estimated Mars position (found in notebook 3 of this series "Compute Mars Orbit")
- Utilize a numerical solver (via
fsolve) to ensure that the computed Earth position yields the correct LOS angle towards Mars.
Fits Earth’s computed positions to an elliptical model and compares the results with accepted astronomical values.
Visualizes Earth’s orbit alongside the positions of Mars and the Sun.
Conclusion
Kepler’s groundbreaking work reshaped our understanding of planetary motion, and today, we can revisit his analysis with modern computational tools. By combining Jupyter Notebooks, Python’s scientific libraries, and AI-assisted coding, we demonstrate how complex data analysis can be performed efficiently and interactively.
This project serves as an example of how AI and open-source tools empower researchers, educators, and enthusiasts to explore scientific discoveries with greater ease and depth.
👉 Check out the full project and try the notebooks yourself! GitHub Repository
References
This work is directly inspired by Terence Tao's project Climbing the Cosmic Distance Ladder. In particular see the two-part video series with Grant Sanderson (3Blue1Brown): Part 1 and Part 2
Further details on Kepler's analysis can be found in Tao's draft book chapter Chapter 4: Fourth Rung - The Planets: Download here
Another insightful video on Kepler’s discoveries is How the Bizarre Path of Mars Reshaped Astronomy [Kepler's Laws Part 2] by Welch Labs.
Mars-Orbit-Workshop contains material to conduct a workshop recreating Kepler's analysis.
The original work of Kepler was published in Astronomia Nova (New Astronomy) in 1609. The book is available on archive.org. See for example this link to chapter 42 of Astronomia Nova 
No comments:
Post a Comment