Links

Thursday, May 30, 2013

OraLatencyMap v1.1 and Testing I/O with SLOB 2

Topic: OraLatencyMap v1.1 is an updated versions of a performance tool aimed at collecting and displaying Oracle wait event histogram data as latency heat maps. We will also briefly discuss an example of the usage of OraLatencyMap in the context of storage testing.

OraLatencyMap v1.1 is now available (see also the GitHub repository) with a few new features and bug fixes (v1.0 is described here). Many thanks to all  who have tried it already and left a note either on the blog or twitter.

The main new feature in v1.1 is an advanced mode allowing for a few more parameters and customization: the number of samples displayed in the map, the number of latency buckets and the possibility limit data collection to a subset of instances (this is relevant for RAC).

Another new feature is that we now display the maximum value of the calculated sum of the displayed values (i.e. the sum of N# of wait events per second and the sum of time waited). This is intended to help with identifying the peak performance values (for example maximum number of IOPS).

README:
OraLatencyMap, a performance widget to visualize Oracle I/O latency using Heat Maps
Luca.Canali@cern.ch, v1.1, May 2013

Credits: Brendan Gregg for "Visualizing System Latency", Communications of the ACM, July 2010, Tanel Poder (snapper, moats, sqlplus and color), Marcin Przepiorowski (topass)

Notes: These scripts need to be run from sqlplus from a terminal supporting ANSI escape codes. 
       Better not use rlwrap when running this, or graphics smoothness will suffer.
       Run from a privileged user (select on v$event_histogram and execute on dbms_lock.sleep)
       Tested on 11.2.0.3, Linux x86_64.

How to start:
      sqlplus / as sysdba
      SQL> @OraLatencyMap 

More examples:
      SQL> @OraLatencyMap_event 3 "log file sync"
      SQL> @OraLatencyMap_advanced 5 "db file sequential read" 12 80 "and inst_id=1"

Output: 2 latency heat maps of the given wait event
         The top map represents the number of waits per second and per latency bucket
         The bottom map represented the estimated time waited per second and per latency bucket
         with the advanced script it is possible to customize sampling time, event name, screen size 
         moreover in RAC, the default is to aggregate histogram data over all nodes, but this is customizable too

Scope:  Performance investigations of wait events' latency. For example single block read latency with OraLatencyMap.sql
         
Related: OraLatencyMap_advanced.sql      -> this is the main script for generic investigation of event latency with heat maps
         OraLatencyMap_event.sql         -> another script based on OraLatencyMap_advanced 
         OraLatencyMap_internal.sql      -> the slave script where all the computation and visualization is done
         OraLatencyMap_internal_loop.sql -> the slave script that runs several dozens of iterations of the tool's engine 

OraLatencyMap and storage testing with SLOB

OraLatencyMap was originally written for troubleshooting and drilling down issues with production DBs. I find that OraLatencyMap can be of help also in the context of storage testing (say for example when installing a new system or evaluating a new storage infrastructure).
SLOB 2 by Kevin Closson is a solid reference and overall a great tool for testing storage with Oracle and in particular for testing random I/O activity. Therefore I have used SLOB to drive the workload for the examples here below.

The outline of this simple test: (1) generate test data with SLOB, (2) run the SLOB test for read-only random IO with increasing load values,(3) run OraLatencyMap while the test is running (focus on IOPS and latency values).
The picture here below shows the output of OraLatencyMap taken during 4 different run of SLOB for increasing load (see also slob.conf below and annotations on the graph).
The measured workload is almost entirely dominated by wait event of the type "db file sequential read", that is for random single-block read.
We can see that by increasing the load (number of concurrent SLOB sessions) we can drive more IOPS out of our storage. At the same time we observe that the latency is increasing with increasing load.
How to read IOPS with OraLatencyMap? The sum of the number of waits per second is the metric to look at. I have copied measured values for IOPS as annotations in the figure here below.

The storage system under test is a simple JBOD configuration of 2 storage arrays with 12 SAS 10K rpm disks per array. The storage is connected to the servers via Fiber Channel (8 Gbps). The database is Oracle 11.2.0.3 for Linux x86_64 with ASM. Storage is allocated on a normal redundancy disk group built with 23 disks from the 2 storage arrays.

Why is this useful? First of all it's a quick and easy way to start investigations of the storage. Single block random read latency is very important for many OLTP applications. We can therefore learn about the latency we can expect from the storage at different loads. We can learn about the maximum IOPS, and overall see the behavior at storage saturation for this type of workload.
Note also that after each run SLOB 2 produces a series of reports (including AWR and iostat) with much more information on the workload that what is available by just observing OraLatencyMap output.

Coming back to the example of the JBOD configuration we can see from the figure below that the measured values for IOPS are consistent with expectations: each disk delivering ~200 IOPS. This is consistent with other measurements previously done on the same system, see also this presentation. The measured latency is in the range of 4-8 ms for low load and starts to increase considerably when we start to drive the disks closer to maximum IOPS, also something that is expected.

SQL> @OraLatencyMap_advanced 10 "db file sequential read" 11 110 ""


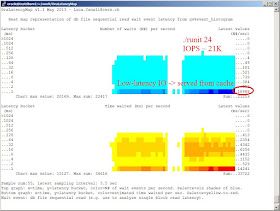
A potential pitfall when testing storage is to run our tests with too little data and in particular to have test data that fit in the controller's cache. The figure here below shows just an example of that. The test data there were easily cached by the arrays (4 GB in total for this system). The net outcome is that we have very high figures for IOPS that just don't make sense with the number and type of disks we have.
Indeed the measured latency values confirm that we are mostly reading from cache: we see that the majority of the measured wait events are in the 1 ms latency bucket (wait time of 1 ms or less).
Note on the test: the main difference between this test and the test described above is in amount of data used. The SLOB parameter SCALE = 10000 for this test, SCALE = 1000000 for the test discussed above.

Comment: the example described here is quite basic, however it is the case that many storage arrays these days come with large amounts of SSD cache. It is important to understand/measure if test data fit in the cache to make sense of the results of the stress tests.

SQL> @OraLatencyMap


Notes: slob.conf and other details regarding the tests. See SLOB 2 manual for more info on the meaning of the parameters.

slob.conf:
UPDATE_PCT=0
RUN_TIME=200
WORK_LOOP=0
SCALE=1000000   #for test N.2 this is scaled down to 10000
WORK_UNIT=256
REDO_STRESS=HEAVY
LOAD_PARALLEL_DEGREE=8
SHARED_DATA_MODULUS=0

How to create test data:
./setup.sh SLOB 128  #this needs about 1TB of space in the SLOB tablespace

Relevant init.ora parameters to force Oracle not to use prefetching/batching optimizations:
db_cache_size=50m
_db_block_prefetch_limit = 0
_db_block_prefetch_quota = 0
_db_file_noncontig_mblock_read_count = 0

Conclusions

OraLatencyMap is a tool for measuring and displaying wait event histogram data in Oracle as latency heat maps. The tool can be used to troubleshoot production issues related to storage latency. OraLatencyMap can be of assistance when testing storage together with Oracle-based stress testing tools such as Kevin Closson's SLOB (see http://kevinclosson.net/slob/).

Wednesday, May 8, 2013

Oracle Events' Latency Visualization and Heat Maps in SQL*plus

Topic: This post is about a technique for Oracle performance tuning, the use of heat maps to investigate wait event latency (and in particular I/O-related latency). This post also discusses a SQL*plus-based script/tool I have developed to help with this type of monitoring and performance drill-down (OraLatencyMap).

Context: Oracle exposes latency data for the wait event interface in  V$EVENT_HISTOGRAM. This gives an additional dimension to drill down performance data for analysis and troubleshooting. In an older blog post I described an example of troubleshooting a storage issue for an OLTP (RAC) database by investigating the histogram data of the 'db file sequential read' wait event. In that context I had also developed and discussed ehm.sql, a simple PL/SQL script to collect and display data from GV$EVENT_HISTOGRAM.

What's new: An excellent article by Brendan Gregg, "Visualizing System Latency", Communications of the ACM, July 2010 has inspired me to develop an enhanced version of ehm.sql. The idea is to display in real time data of current and historical values of selected wait event histograms. In particular I/O-related events such as db file sequential read and log file sync make excellent candidates for this type of analysis. Moreover those events are relevant in a context that is familiar to me, that is drilling down issues with OLTP performance and access to storage.
As Brendan shows in his article, I/O latency data fits naturally to heat map representation, where time is on the horizontal axis, latency buckets are on the vertical axis and the quantity to display (for example number of waits or time waited) is displayed as color (hence the name heat map).

The tool: OraLatencyMap is a tool I have developed to help extract and represent event histogram data in a heat map. It is intended to be lightweight and 'DBA-friendly'. It's implemented in PL/SQL, it does not require the creation of any DB objects and runs under SQL*plus. OraLatencyMap requires a terminal supporting ANSI escape codes (for example PuTTY, MobaXterm, xterm, notably it does not run under windows' cmd.exe). Making SQL*plus behave like a monitoring tool, requires jumping through hoops. Credits to the experts who have shared their results in this area and thus made my job much easier here. In particular: Tanel Poder (for moats, sqlplus and color, snapper, etc..), Adrian Billington (moats) and Marcin Przepiorowski (topaas).

Example 1: study of db file sequential read
See here below a screen shot of a putty terminal where I ran SQL*plus and @OraLatencyMap. The script samples GV$EVENT_HISTOGRAM roughly every 3 seconds and displays 2 heat maps. The top heat map gives information on the number of waits per second on each latency bucket. The bottom heat map instead represents the estimated wait time per latency bucket. The two graphs represent the same type of information but with 2 different 'points of view'.

SQL> @OraLatencyMap


This type of data is useful when investigating single block read latency issues in OLTP systems for example. I'll leave for another time a discussion of the details and limitations of this approach.  I'll just point out that among others, it's also important to make sure the system is not starving with CPU to make sense of the data (CPU data not shown here). When reading the heat map I typically focus on 3 areas: one is low-latency (1ms) where I get info on what is most likely reads from storage cache, the second is the area of latency around the 16 and 32 ms buckets, most likely representing physical reads from 'rotating disks'. The third very interesting area to watch is the 'high latency' (>100ms), that is the area of "IO latency outliers" and can be sign of problems with the storage for example. Note that OraLatencyMap is a drill-down tool based on Oracle instrumentation so the interpretation of the results, especially when extended to storage, will often need additional data from the specific context being investigated. 

Example 2: study of log file sync
This example is about visualizing the latency of log file sync. This can be useful when drilling down commit latency issues. This is a critical area for many OLTP systems and the troubleshooting is often not easy: storage performance, server CPU starvation and unexpected behavior by LGWR, among others can all potentially cause problems in this area.
This screen shot was taken from a putty window, this time with a white background.

SQL> @OraLatencyMap_event 3 "log file sync"


Note: See also the blog entry on OraLatencyMap v1.1

Conclusions
Latency investigations of Oracle wait events give an additional and powerful dimension to performance tuning and troubleshooting. This is particularly useful for (synchronous) I/O-related wait events such db file sequential read and log file sync. Latency heat maps are a particularly suited to visualize IO latency (see also Brendan Gregg's article). The first version of a simple SQL*plus script (OraLatencyMap) to collect and visualize event histogram data as heat maps has been discussed.
OraLatencyMap is available for download from http://canali.web.cern.ch/canali/resources.htm and on GitHub